Đề ngày 6/4/2019
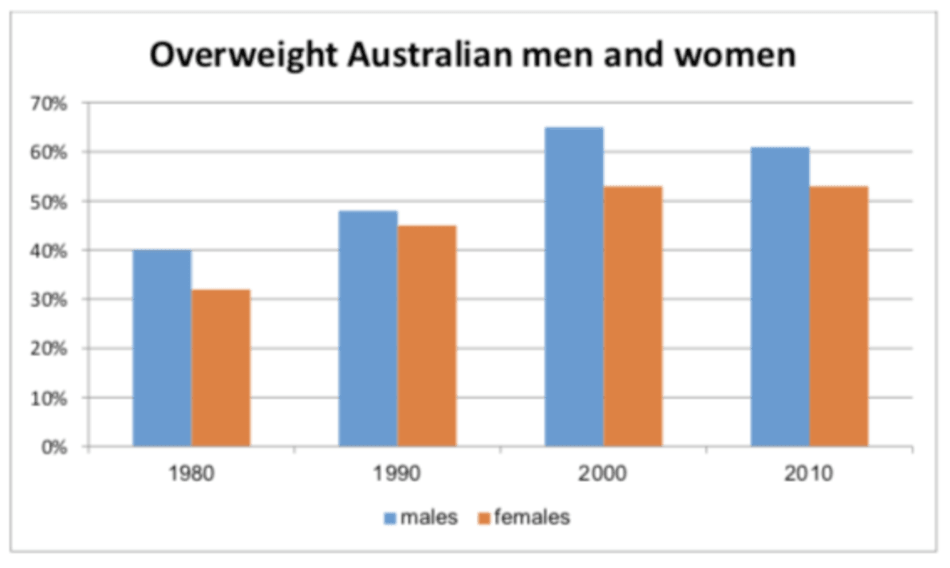
The chart shows the percentage of males and females who were overweight in Australia from 1980 to 2010.
Summarise the information by selecting and reporting the main features, and make comparisons where relevant.
Write at least 150 words
Sample answer
The bar chart gives information about the percentages of Australian males and females with obesity from 1980 to 2010.
Overall, there were more men than women suffering from obesity over the surveyed years. The proportion of overweight males witnessed an upward trend nearly throughout the period with an exception for the year 2010, whereas that of overweight females also experienced a similar trend yet at a slower pace.
At the beginning of the period, 40% of Australian men were obese, whereas nearly a third of women suffered from the same health problem. Thereafter, the proportion of obese males rose significantly, reaching its peak at 65% in 2000, while the growth of females’ was slower, increasing to around 52% in the same year. The final year of the period given witnessed a slight fall of overweight Australian men’s percentage, declining to approximately 60%, as opposed to that of women which remained unchanged.