Đề ngày 20/6/2020: Rice exports from Thailand and Vietnam

T6, 05/10/2018
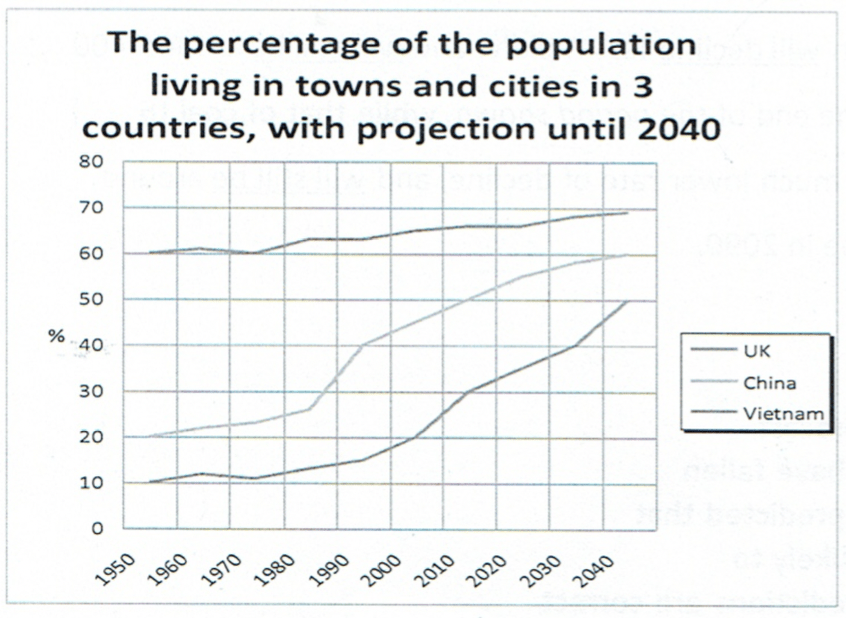
The chart shows the percentage of the population living in towns and cities in 3 countries, with a projection until 2040.
Summarise the information by selecting and reporting the main features and make comparisons where relevant.
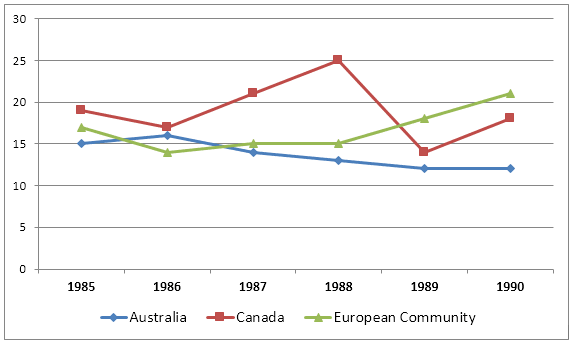
The graph below shows the differences in wheat exports over three different areas. Summarise the information by selecting and reporting the main features and make comparisons where relevant. Write at least 150 words
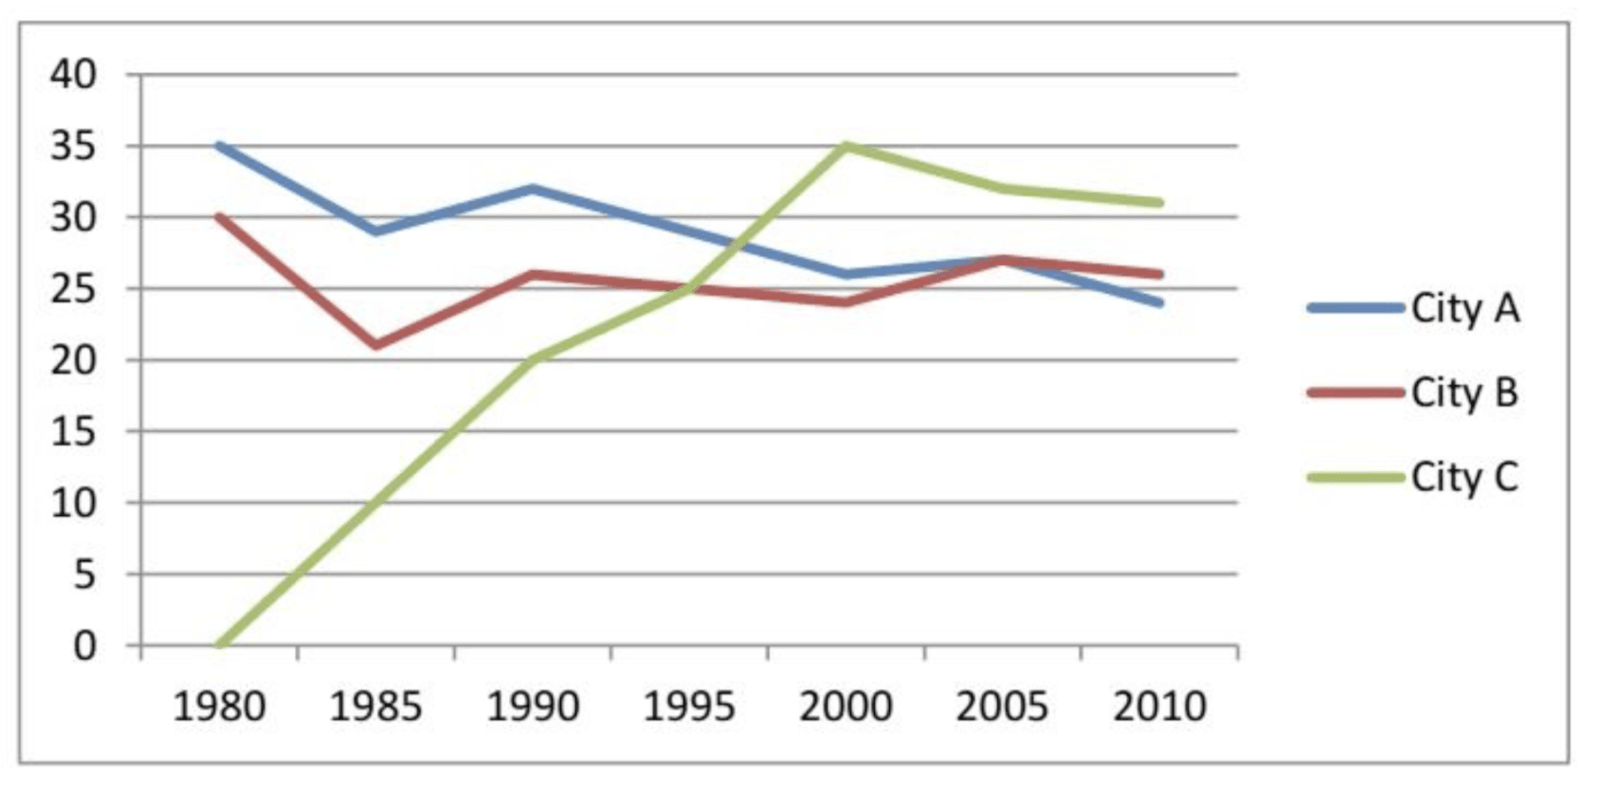
Đề ngày 18/08/2018 The graph shows the information about international conferences in three capital cities in 1980 – 2010 Summarise the information by selecting and reporting the main features, and make comparisons where relevant.
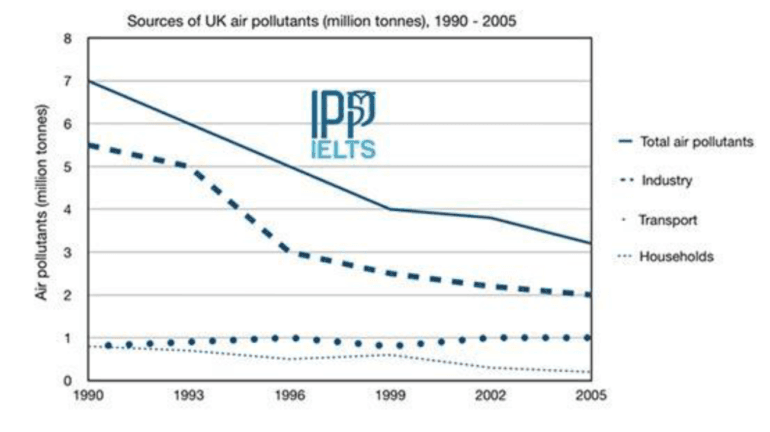
Đề ngày 21/07/2018 The graph below shows different sources of air pollutants in the UK from 1990 to 2005. Summarise the information by selecting and reporting the main features, and make comparisons where relevant. (Phần biểu đồ nguồn lấy từ report

T7, 30/03/2019
T7, 27/06/2020

T3, 23/06/2020

T5, 11/06/2020

