Line graph (biểu đồ đường)

Đề ngày 11/5/2019: Car ownership per household in the UK

T7, 10/08/2019

Đề ngày 11/05/2019

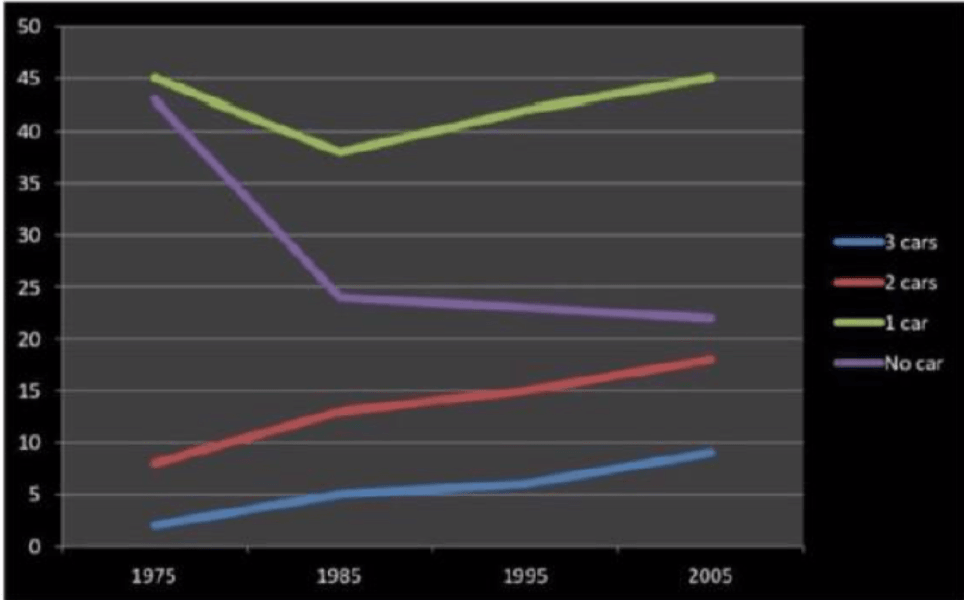
The chart below gives information about car ownership per household in the UK from 1975 to 2005, measured in percentage.

Summarise the information by selecting and reporting the main features, and make comparisons where relevant.

Write at least 150 words
Nộp bài writing task 1

Sample answer

The line graph compares the percentages of car numbers owned per household in the UK between 1975 and 2005.

Overall, it is clear that throughout the whole period, most British households had 1 car and the rates of households owned 2 and 3 cars showed an upward trend. Besides, the greatest change occurred in the figure for household having no car.

At the beginning of the period, the percentage of households with 1-car ownership was the highest, achieving around 45%, while that of 2 and 3-car ownership accounted for only approximately 8% and 2% respectively. After reaching its low at 38% in1985, the rate of households owning 1 car witnessed a recovery, rising gradually but surely for the remaining period. It is interesting to note that the figure for the final year is exactly the same with figure for 1975.

Meanwhile, the proportions of UK households having 2 cars and 3 cars presented a similar upward trend throughout the whole period. It is noticeable that from 1985 the figure for households with 3-car ownership lagged that of households with 2-car ownership by a double margin, and ended the period at around 9% and 18% respectively.

In contrast, the rate of households having no car underwent a rapid drop in 1985, falling to under 25%, and continued to decrease slightly until 2005, standing at approximately 22%.

Cùng chủ đề

Đề ngày 21/7/2018: Air pollutants in the UK

Đề ngày 21/7/2018: Air pollutants in the UK
T7, 10/08/2019

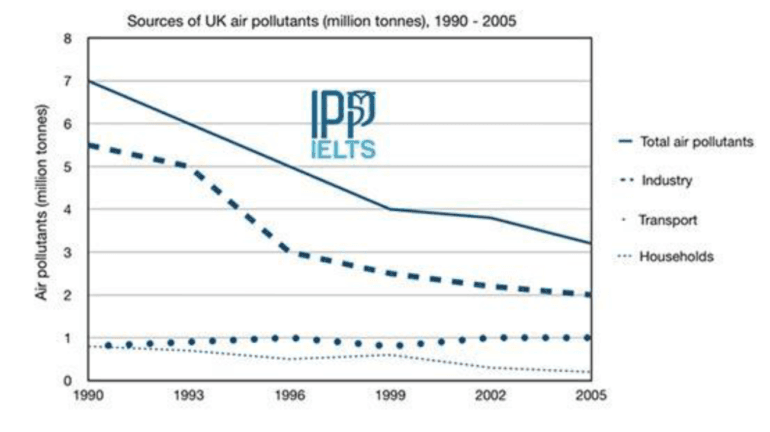
Đề ngày 21/07/2018 The graph below shows different sources of air pollutants in the UK from 1990 to 2005. Summarise the information by selecting and reporting the main features, and make comparisons where relevant. (Phần biểu đồ nguồn lấy từ report

Liên Kết Chia Sẻ

** Đây là liên kết chia sẻ bởi cộng đồng người dùng, chúng tôi không chịu trách nhiệm gì về nội dung của các thông tin này. Nếu có liên kết nào không phù hợp xin hãy báo cho admin.