Bar chart with years (biểu đồ cột có năm)

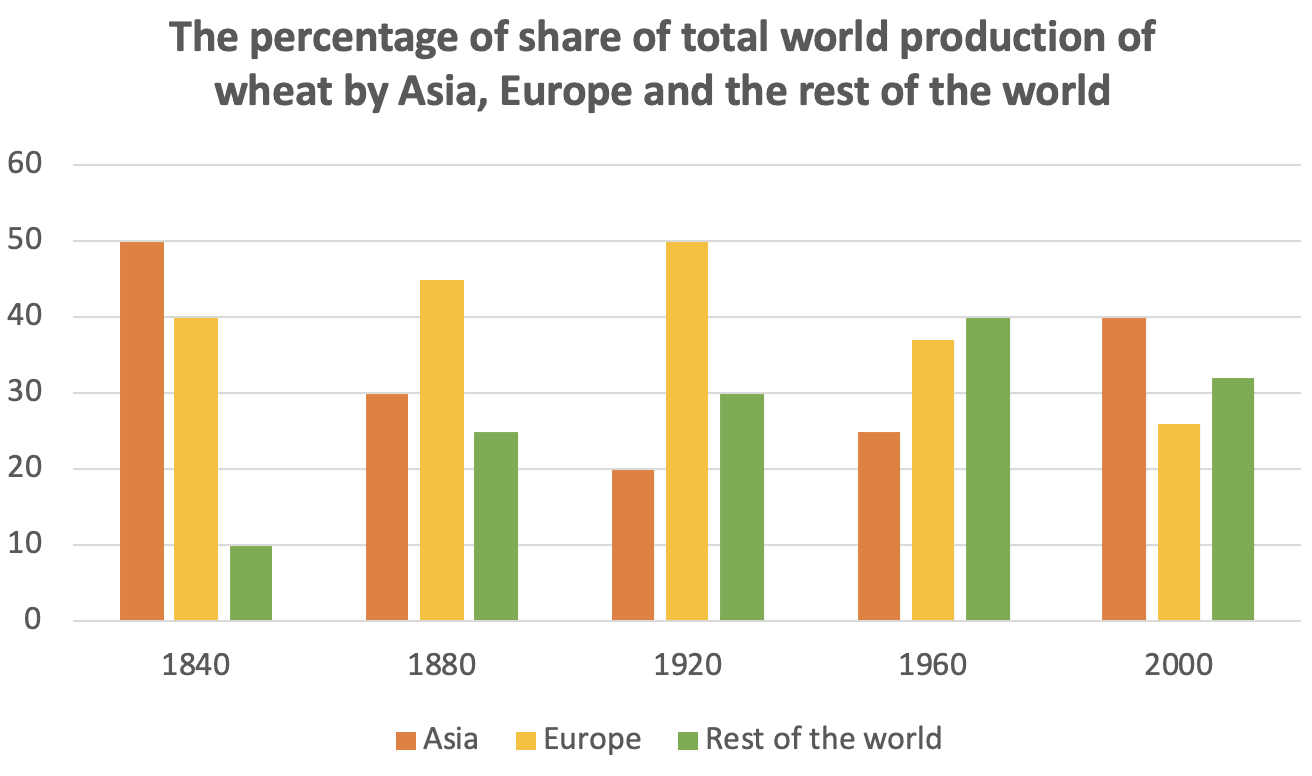
Đề ngày 19/10/2019: Share of total world production of wheat

T7, 19/10/2019

Đề ngày 19/10/2019

The diagram below shows the percentage of share of total world production of wheat by Asia, Europe and other part of the world from the years 1840 to 2000.

Summarise the information by selecting and reporting the main features and make comparisons where relevant.

Write at least 150 words

Nộp bài writing task 1

Cùng chủ đề

Đề ngày 25/4/2019: Car sales

Đề ngày 25/4/2019: Car sales
T5, 15/08/2019

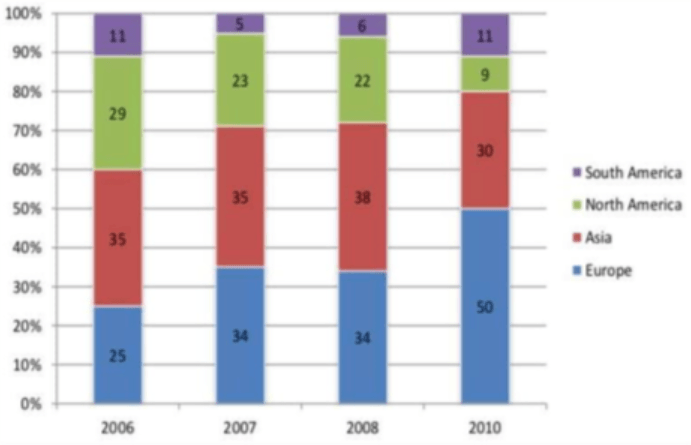
Đề ngày 25/4/2019 The chart shows the percentage of car manufacturer's total car sales in different regions from 2006 to 2010. Summarise the information by selecting and reporting the main features, and make comparisons where relevant. Write at least 150

Liên Kết Chia Sẻ

** Đây là liên kết chia sẻ bởi cộng đồng người dùng, chúng tôi không chịu trách nhiệm gì về nội dung của các thông tin này. Nếu có liên kết nào không phù hợp xin hãy báo cho admin.