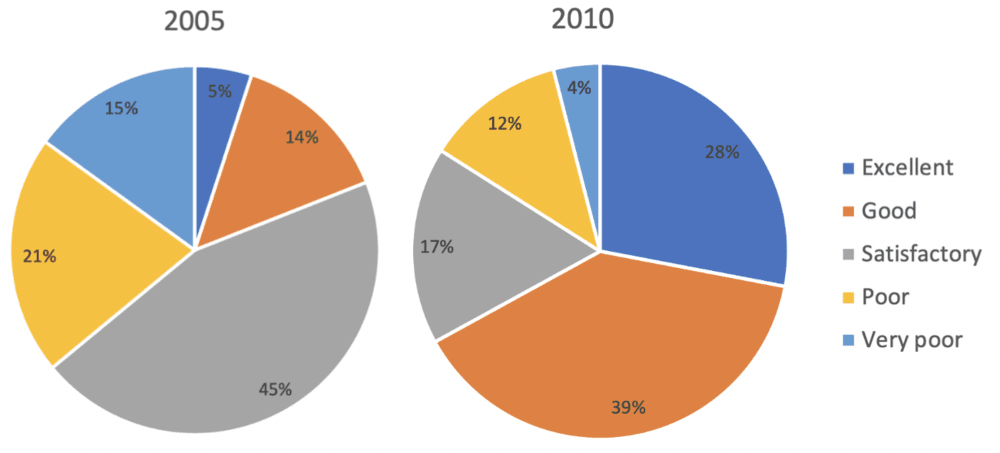
The charts below show the results of a questionnaire that asked visitors to the Parkway Hotel how they rated the hotel’s customer service in the years 2005 and 2010.
Write at least 150 words
Sample answer
The pie charts give information about how visitors to Parkway Hotel satisfied with its customer service between 2005 and 2010.
Overall, the proportions of customers with positive feedbacks increased significantly, while the figures for negative ratings experienced an opposite trend.
In 2005, Parkway hotel’s guests rating the service as excellent accounted for the least proportion with only 5%, but five years later the percentage of people with this feedback was more than five times higher, standing at 28%. Similarly, the figure for those who thought the hotel’s customer service was good witnessed a rapid increase, rising from 14% in 2005 to just under 40% in 2010.
Most visitors (45%) rated Parkway hotel’s customer service as satisfactory, while the proportions of guests giving poor and very poor feedbacks stood at 21% and 15% respectively in 2005. The year 2010 witnessed a considerable fall in the figures for these feedback types. In particular, only 17% of people staying at the hotel rated the customer service satisfactory, and the percentages of guests with poor and very poor ratings were just 12% and 4% respectively.
Word count: 181 words