Students with educational problems
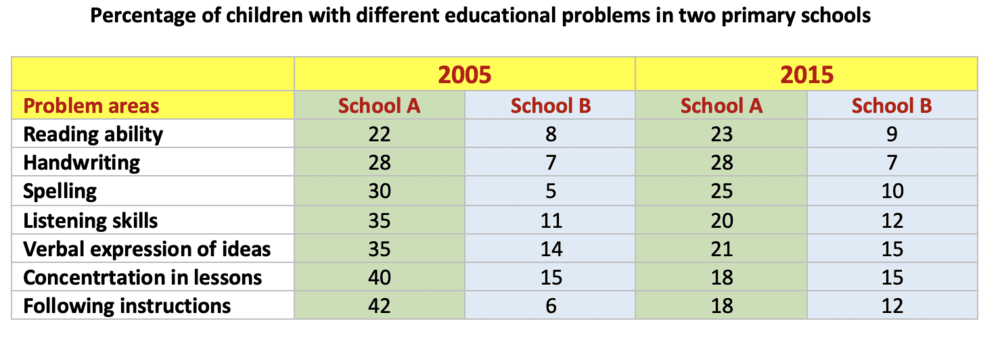
T5, 12/03/2020
The table below gives information about the problems faced by children in two primary schools in 2005 and 2015 Write at least 150 words
T7, 06/10/2018
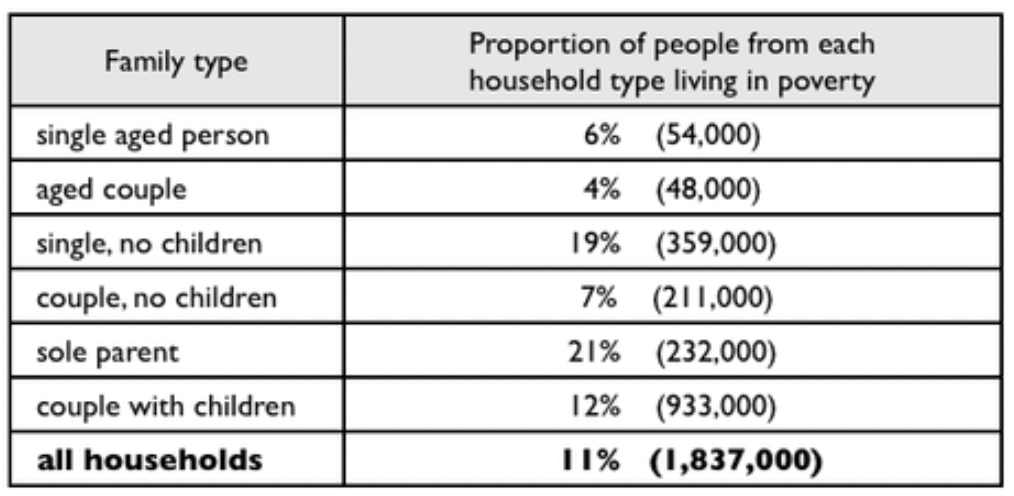
The table below shows the proportion of different categories of families living in poverty in Australia in 1999.
Summarise the information by selecting and reporting the main features, and make comparisons where relevant.
The table below gives information about the problems faced by children in two primary schools in 2005 and 2015 Write at least 150 words
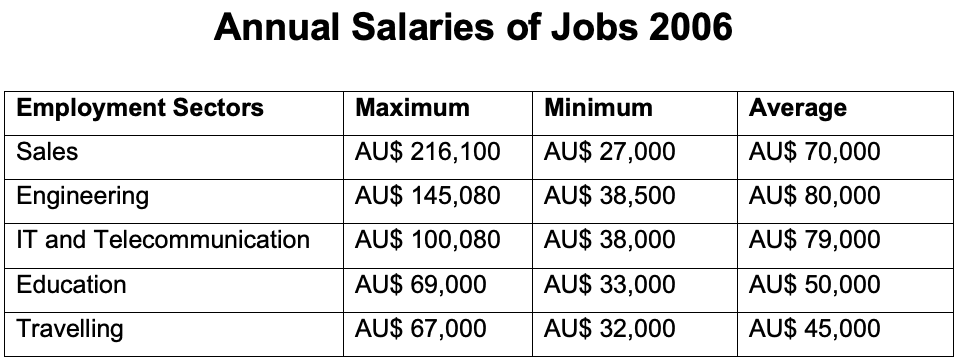
Đề ngày 12/10/2019: The table gives information about annual salaries of five employment sectors in Australia in 2006. Summarise the information by selecting and reporting the main features and make comparisons where relevant. write at least 150 words
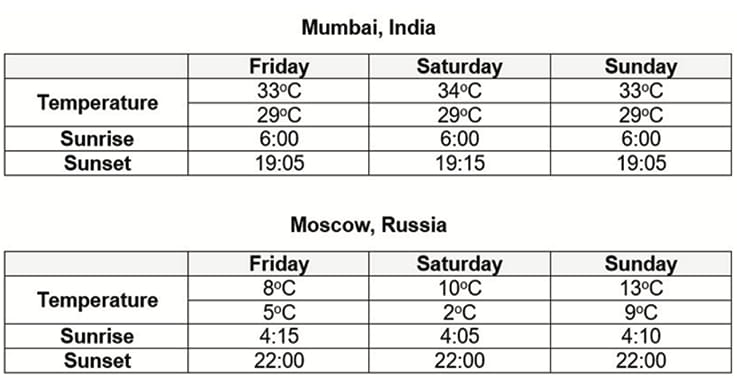
Đề ngày 1/8/2019 The tables below give information about the temperatures and hours of daylight in two cities during the same weekend in May 2007. Summarise the information by selecting and reporting the main features, and make comparisons where relevant
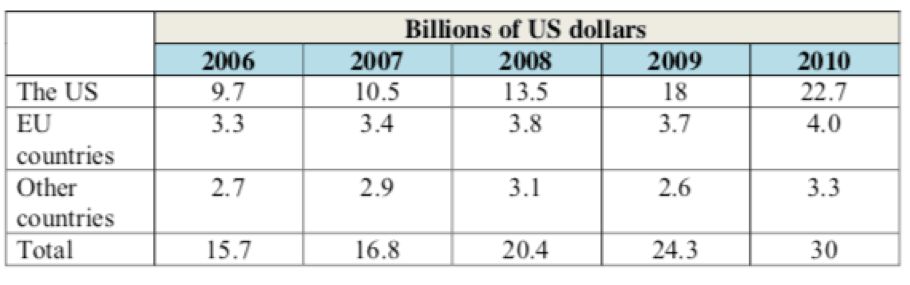
Đề ngày 10/3/2018: The table shows the amount of money given in aid of technology of developing countries by charities in the US, EU and other countries from 2006 to 2010. Summarise the information by selecting and reporting the main features, and make c

T7, 30/03/2019

T7, 27/06/2020

T3, 23/06/2020

T5, 11/06/2020

