Đề ngày 17/9/2019: The production of soft cheese
T5, 26/09/2019
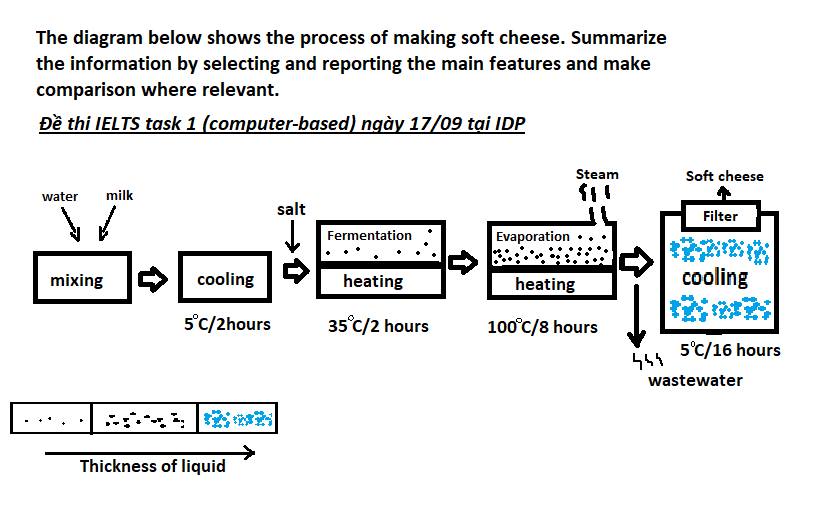
Đề ngày 17/9/2019 The diagram below shows the process of making soft cheese. Nguồn: bạn Phan Đạt report sau khi thi
Đề ngày 17/9/2019 The diagram below shows the process of making soft cheese. Nguồn: bạn Phan Đạt report sau khi thi

Part 1 có 14 chủ đề mới so với đề của quý trước. Thông thường giám khảo sẽ giữ lại khoảng 50% và cập nhật mới 50%.
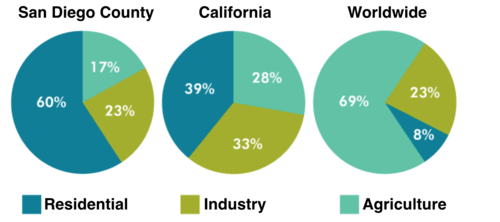
The pie charts below compare water usage in San Diego, California and the rest of the world. Summarise the information by selecting and reporting the main features and make comparisons where relevant. Write at least 150 words
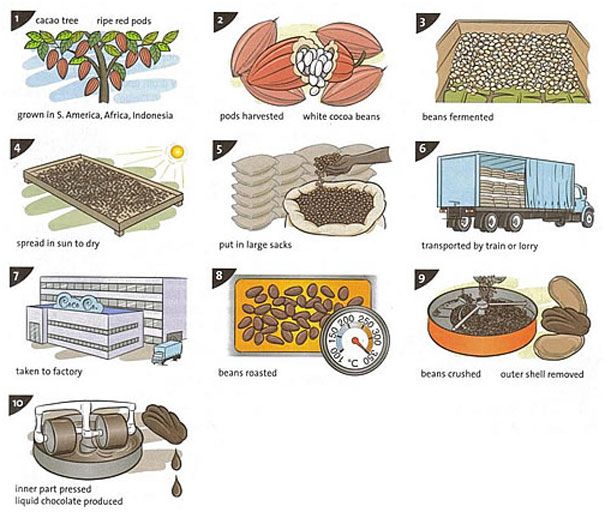
The illustrations show how chocolate is produced. Summarize the information by selecting and reporting the main features and make comparisons where relevant.
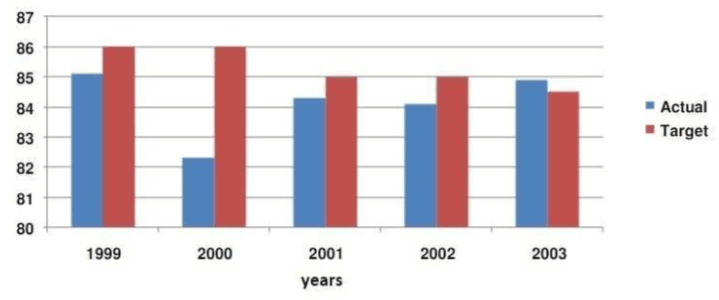
Đề ngày 9/3/2019: The charts below show the performance of a bus company in terms of punctuality, both actual and target (what actually happened compared to what the company was trying to achieve) and the number of complaints from passengers. Summarise

Đề ngày 14/3/2019 The flow chart below shows the procedure to get a driving license in the US. Summarise the information by selecting and reporting the main features.
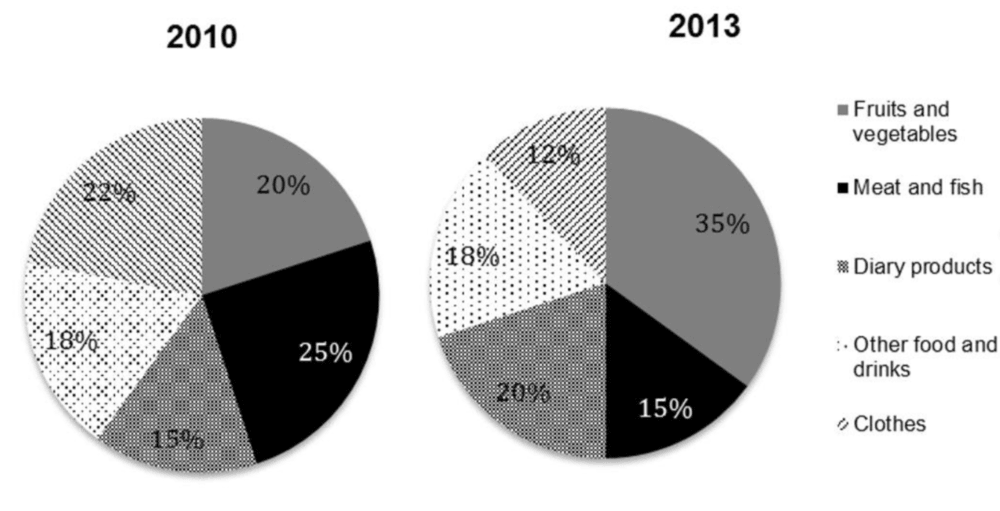
Đề ngày 3/2/2018 The table and pie charts below give details about household income and spending on food and clothes by an average family in one UK city in 2010 and 2013.
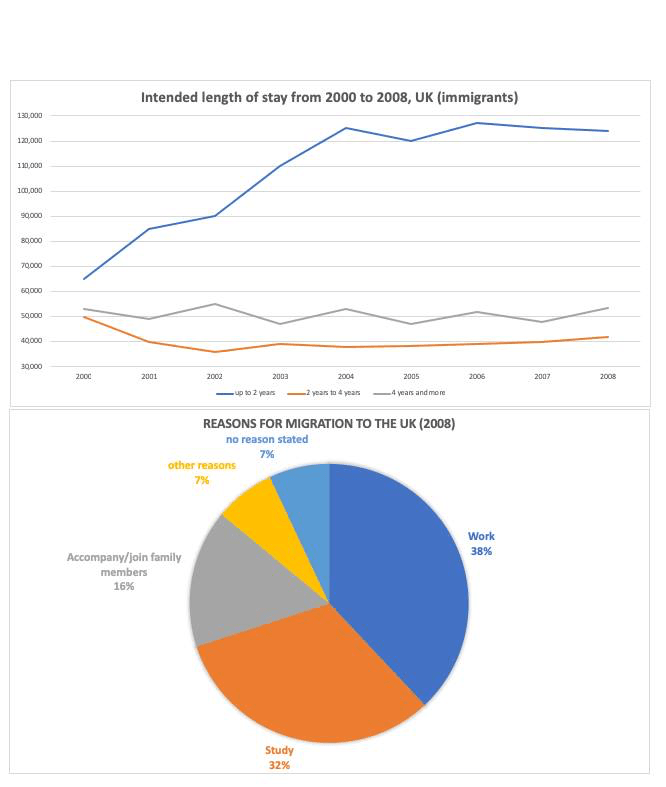
Đề ngày 3/6/2019 The graph and chart give information about the migration to the UK between 2000 and 2008. The line graph shows the intended length of stay of immigrants. The pie chart shows the reasons for migration to the UK in 2008. Summarise the info
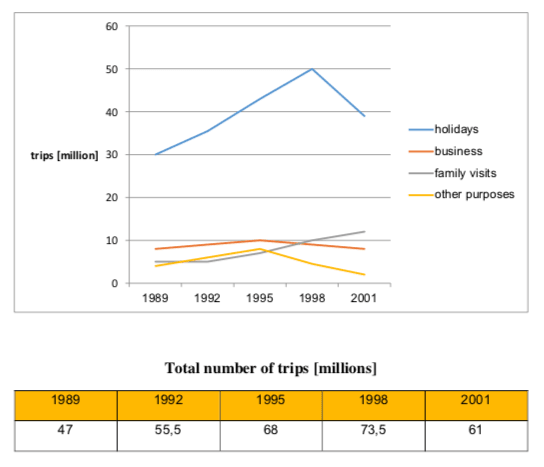
Đề ngày 15/03/2019 The line graph and the table show the number of trips to other countries by UK residents for various purposes between 1989 and 2001. Summarise the information by selecting and reporting the main features, and make comparisons where rel
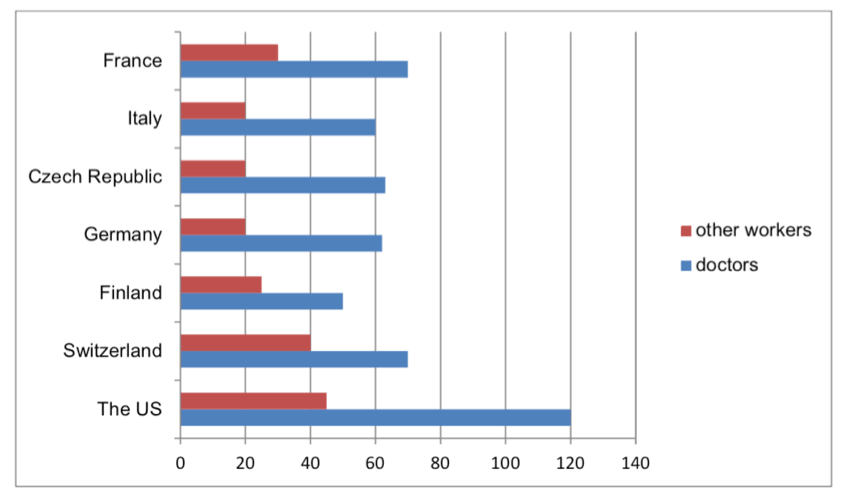
Đề ngày 3/3/2018 The chart below shows the annual pay (thousands of US dollars) for doctors and other workers in seven countries in 2004. Summarise the information by selecting and reporting the main features and make comparisons where relevant.
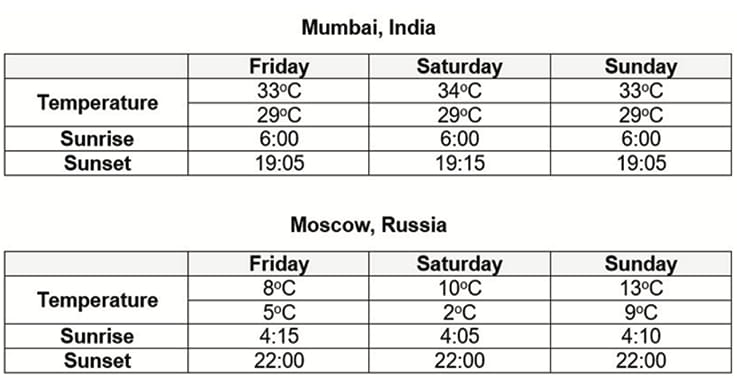
Đề ngày 1/8/2019 The tables below give information about the temperatures and hours of daylight in two cities during the same weekend in May 2007. Summarise the information by selecting and reporting the main features, and make comparisons where relevant
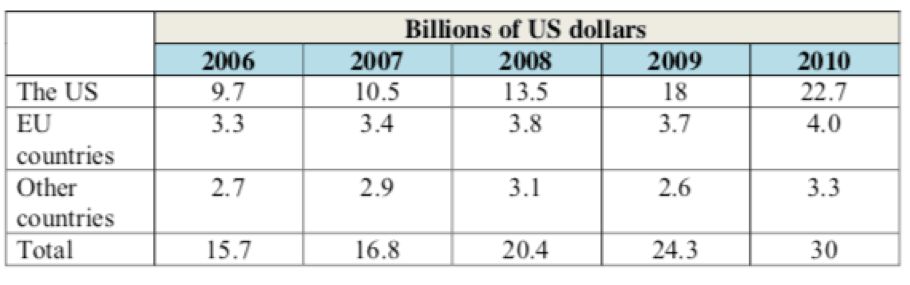
Đề ngày 10/3/2018: The table shows the amount of money given in aid of technology of developing countries by charities in the US, EU and other countries from 2006 to 2010. Summarise the information by selecting and reporting the main features, and make c
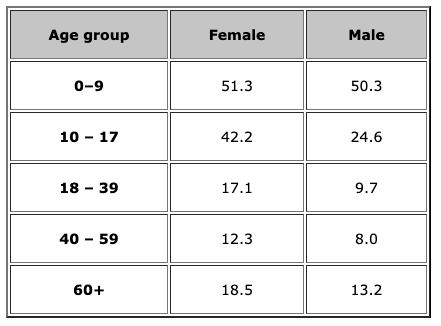
The table below shows the percentage of the population by age groups in one town who rode bicycles in 2011. Summarise the information by selecting and reporting the main features and make comparisons where relevant.
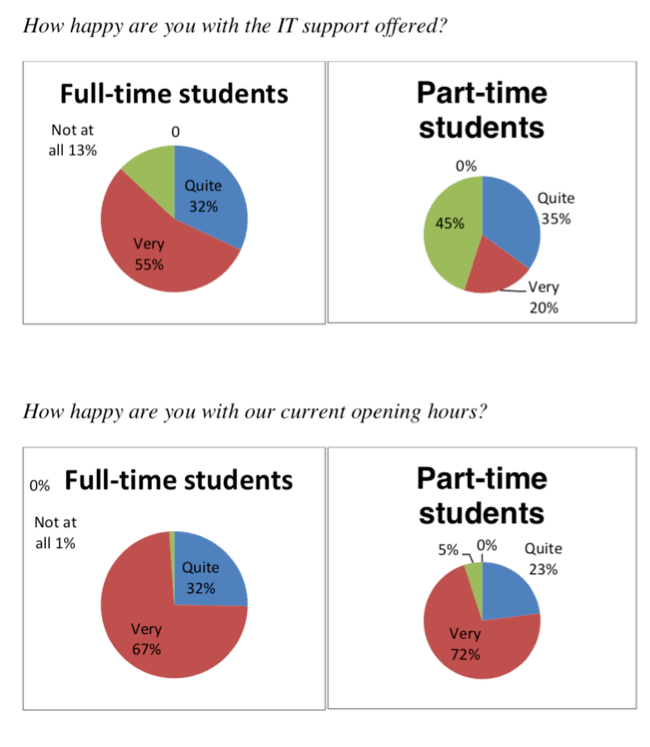
Đề ngày 10/02/2018: The charts below show the results of a survey conducted by a university library to find out opinions of full-time and part-time students about its services. Summarise the information by selecting and reporting the main features and ma
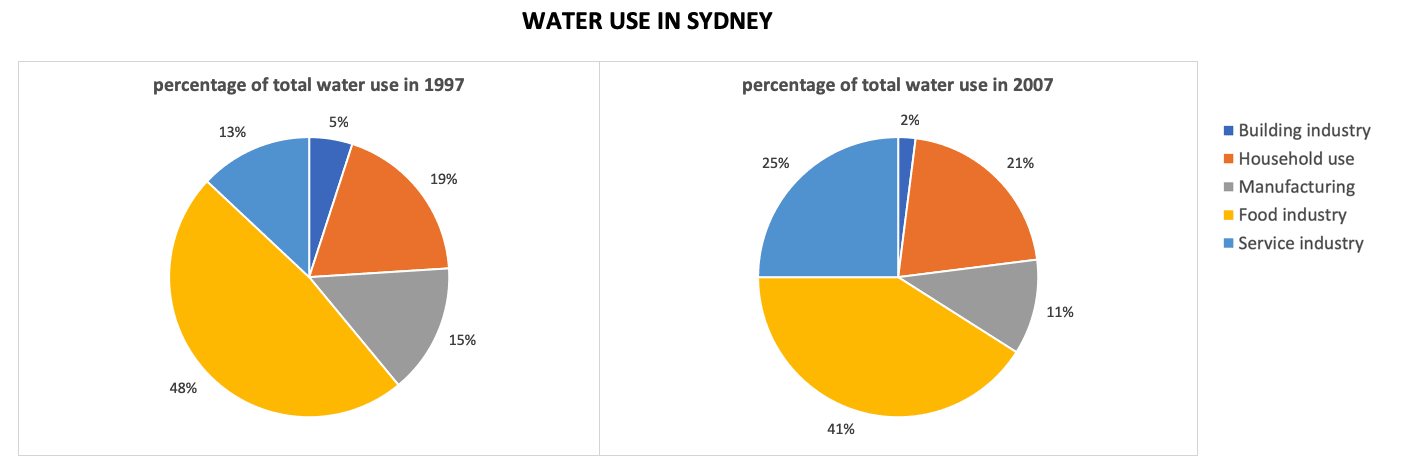
Đề ngày 24/5/2018 The charts below show the percentage of water used by different sectors in Sydney, Australia, in 1997 and 2007. Summarise the information by selecting and reporting the main features and make comparisons where relevant. Write at least 1
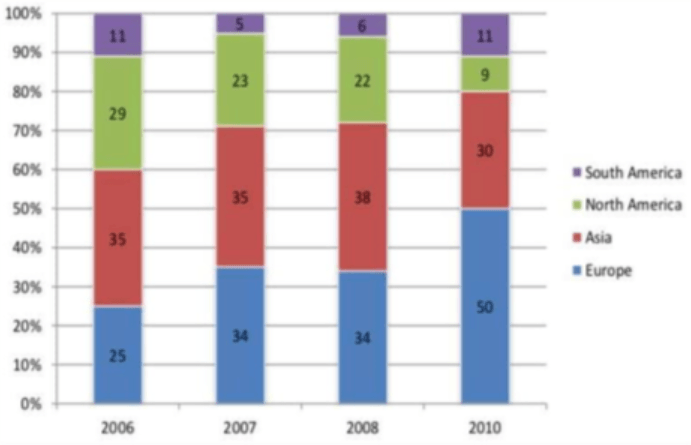
Đề ngày 25/4/2019 The chart shows the percentage of car manufacturer's total car sales in different regions from 2006 to 2010. Summarise the information by selecting and reporting the main features, and make comparisons where relevant. Write at least 150
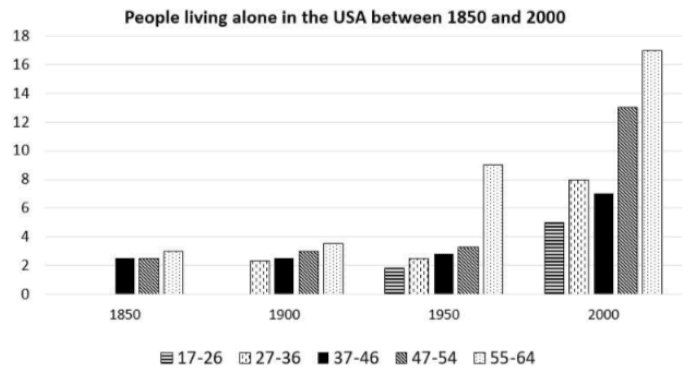
Đề ngày 28/07/2018 The bar chart below shows the percentage of people living alone in five different age groups in the USA between 1850 and 2000. Summarise the information by selecting and reporting the main features, and make comparisons where relevant.
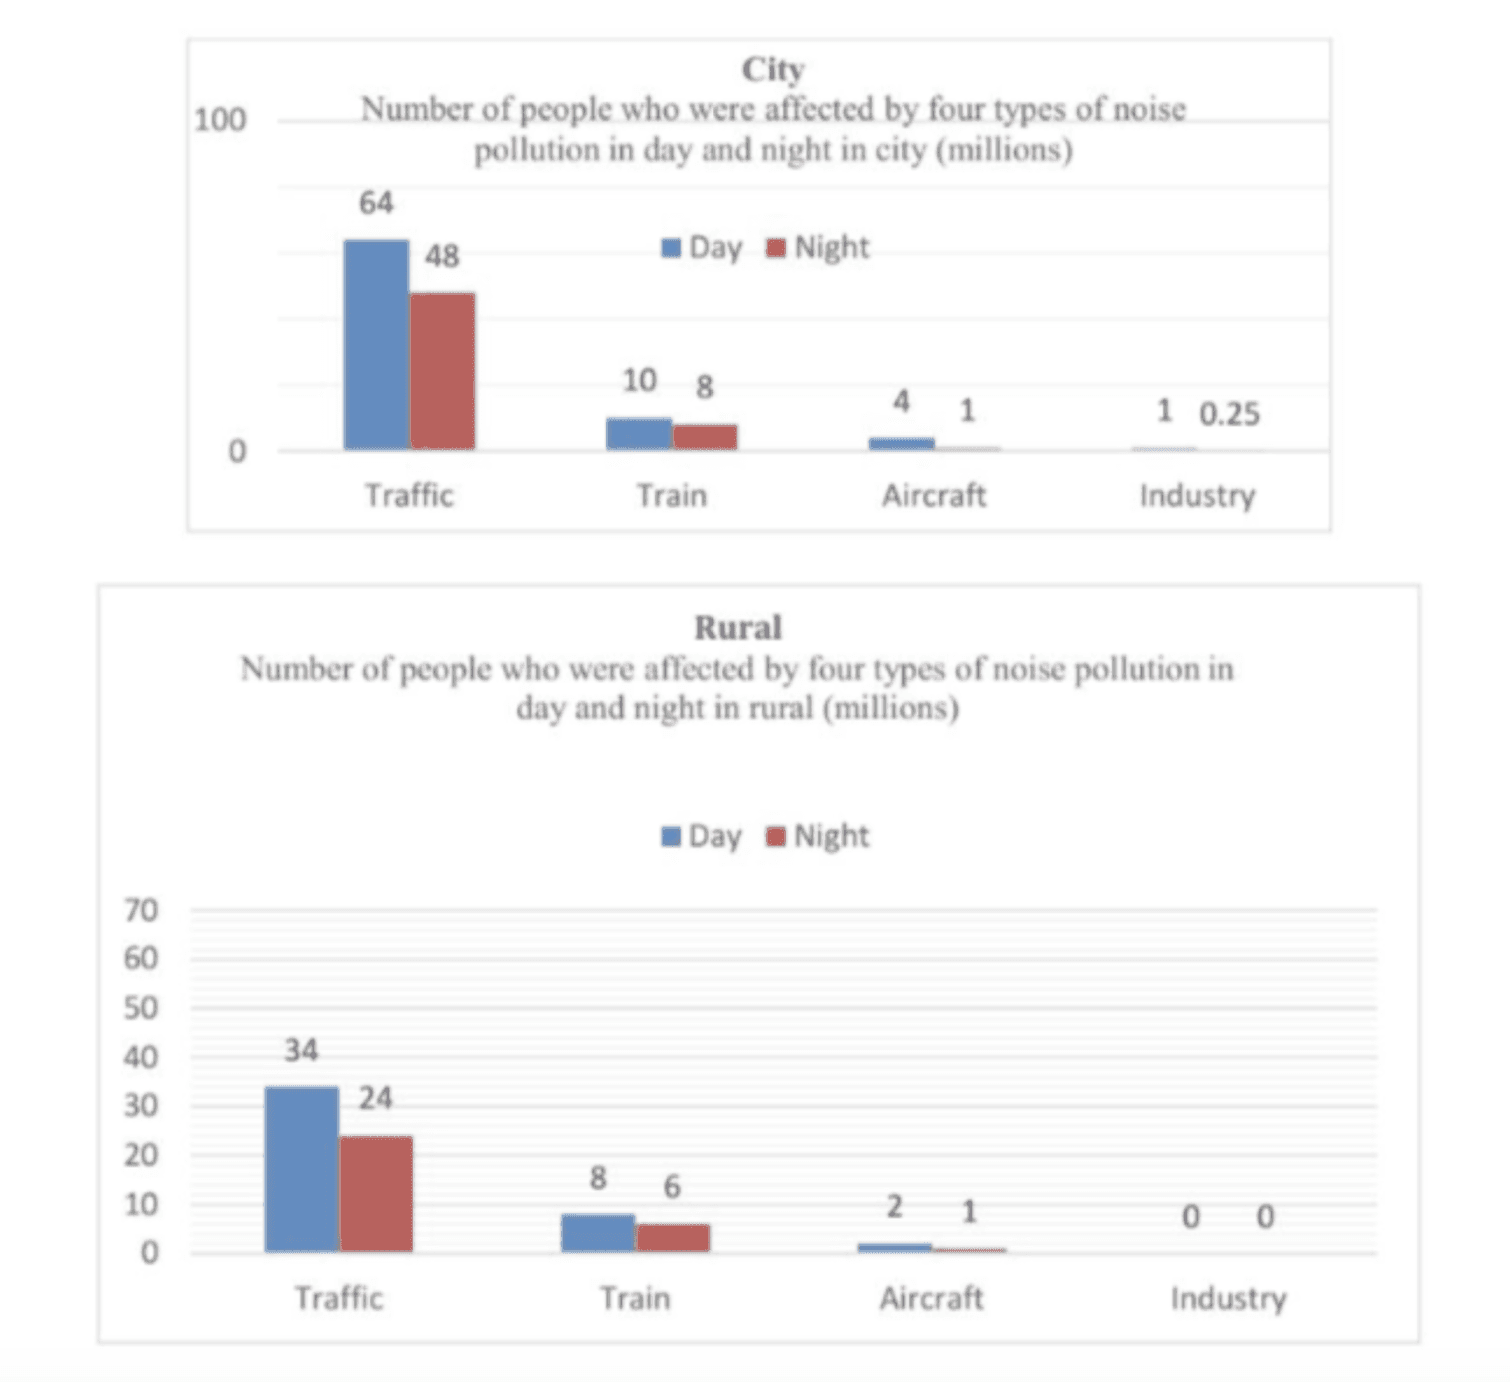
Đề ngày 25/8/2018 The charts illustrate the number of people who were affected by four types of noise pollution in day and night in cities and rural areas in 2007. Summarise the information by selecting and reporting the main features, and make compariso
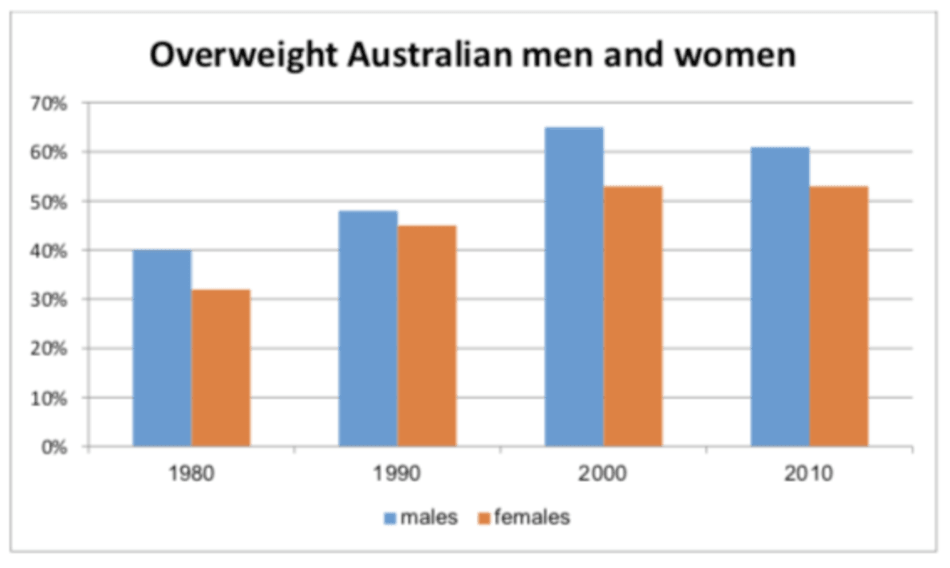
Đề ngày 6/4/2019 The chart shows the percentage of males and females who were overweight in Australia from 1980 to 2010. Summarise the information by selecting and reporting the main features, and make comparisons where relevant. Write at least 150 words

T7, 30/03/2019

T7, 27/06/2020

T3, 23/06/2020

T5, 11/06/2020

