Đề ngày 3/6/2019
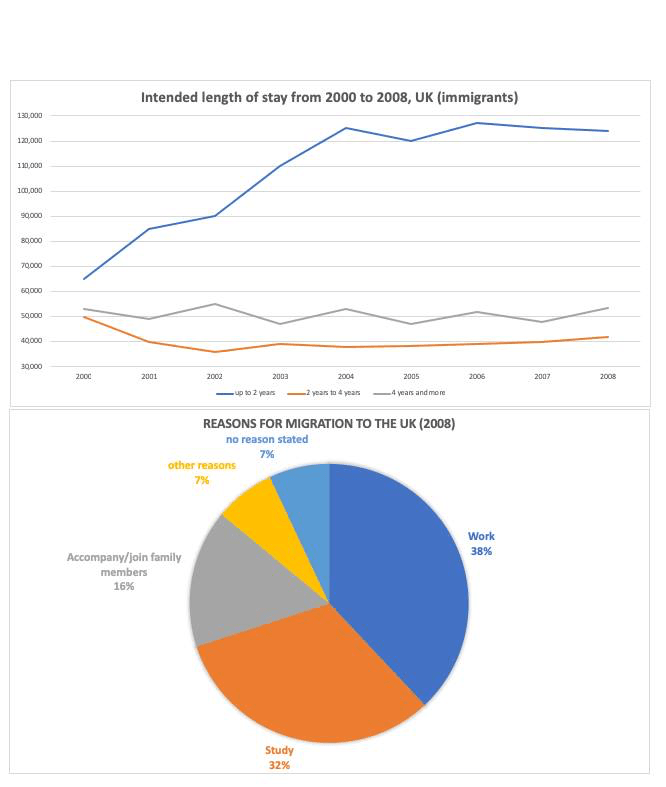
The graph and chart give information about the migration to the UK between 2000 and 2008. The line graph shows the intended length of stay of immigrants. The pie chart shows the reasons for migration to the UK in 2008.
Summarise the information by selecting and reporting the main features, and make comparisons where relevant.
Write at least 150 words
Sample answer
The line graph indicates information about the number of immigrants in accordance with their planned time length of stay in the UK from 2000 to 2008, while the pie chart illustrate the proportion of reasons why people migrated to this country in the year 2008.
Overall, it is clear that most immigrant intended to stay in the UK for up to 2 years and a majority of them came to the country for study and employment.
In the beginning, there were 50,000 immigrants planning to stay in the UK for up to 2 years, after which the figure increased rapidly to 1250,000 in 2004. After a fluctuation, the number of people immigrating to the UK reached its peak of approximately 127,000 in 2006, followed by a slight fall to 110,000 in the final year. The quantity of immigrants who intended to stay for 4 years and more in the UK fluctuated over the period. Interestingly, the figure of around 52,000 in 2000 is similar with the figure for the year 2008. After a drop from 50,000 to 36,000 between 2000 and 2002, the number of those who had 2-year-to-4-year length of stay experienced an increase over the remaining years, reaching just over 40,000 in 2008.
It can be seen that work and study were the two most common reasons for migration to the UK in 2008, accounting for 38% and 32% respectively. 16% of people migrated to the UK so as to accompany or join their family members. The proportions of those who came to the country for other purposes and gave no response were on par, at 7% both.