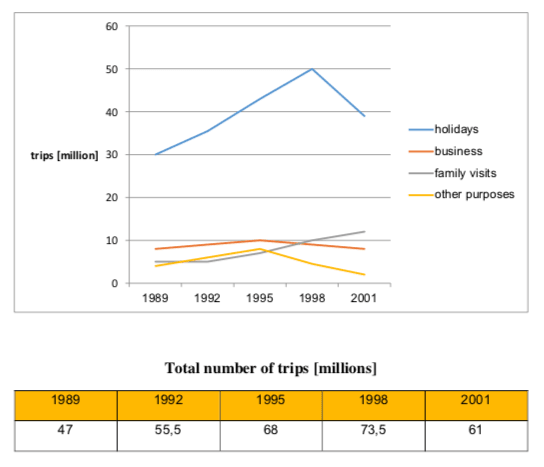
The graph gives information about the quantity of overseas trips by British people for four particular reasons from 1989 to 2001.
Overall, it can be seen that most UK citizens travelled abroad for their holidays. The total number of trips experienced an upward trend nearly throughout the whole period with an exception for the year 2001.
There were 30 million overseas holiday trips made in the beginning, after which the figure grew rapidly and reached a peak of 50 million in 1998. The final year witnessed a fall in the number of trips for holiday, dropping to just under 40 million.
UK residents went on 8 million business trips in 1989 and the figure grew slightly until 1995 when it hit a peak of 10 million, followed by a slight fall during the remaining years. Interestingly, the quantity of the final year is the same with the figure for the first year. The number of trips for other purposes showed a similar trend, doubling to a peak of 8 million between 1989 and 1995 before declining to only 2 million in 2001. In contrast, trips to visit family members increased steadily to 12 million over the period.
In total, 47 million overseas trips were made in 1989. After going up to 55,5 million in 1992 and 68 million in 1995, the figure peaked at 73,5 million in 1998 and then declined to 61 million in 2001.
Word count: 200 words