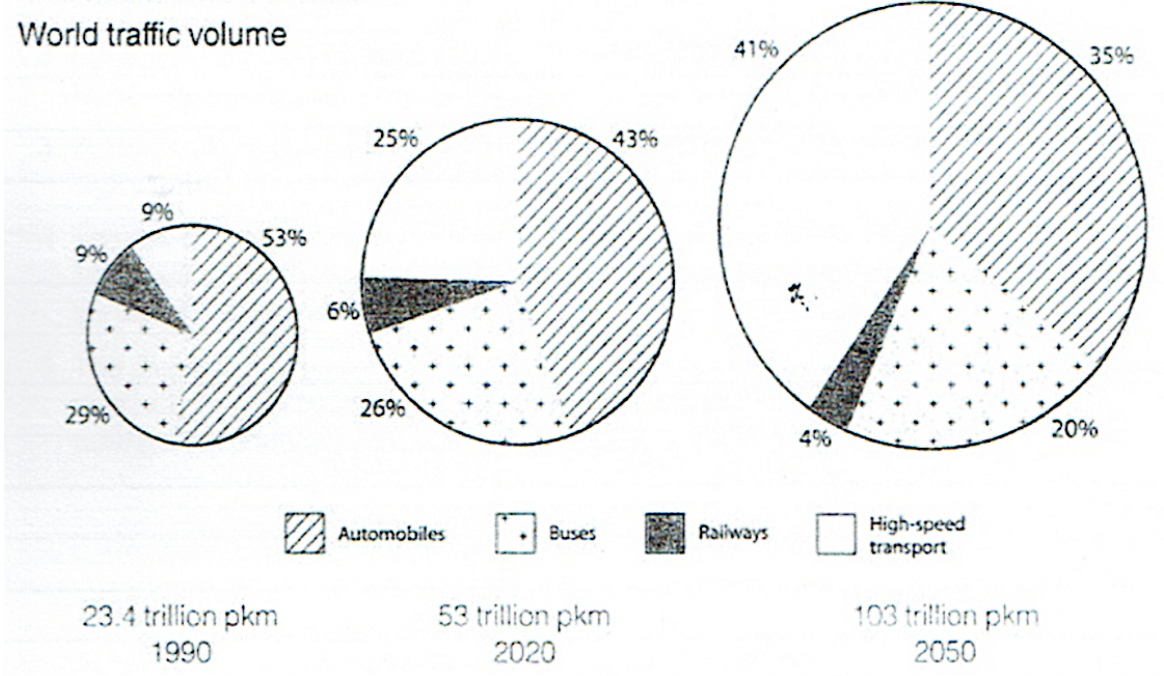
World traffic volume

World traffic volume
T2, 08/10/2018

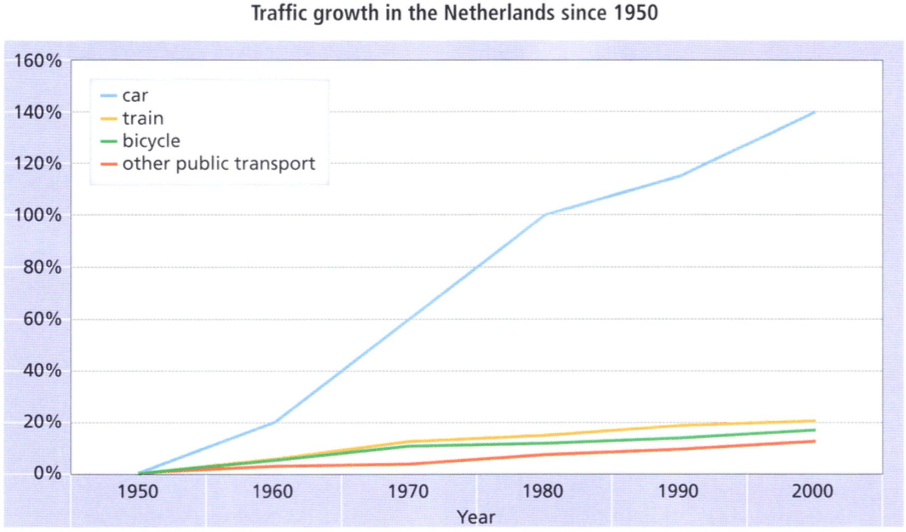
The charts below show the world traffic volume measured in passenger-kilometre-miles. Summarise the information by selecting and reporting the main features, and make comparisons where relevant.
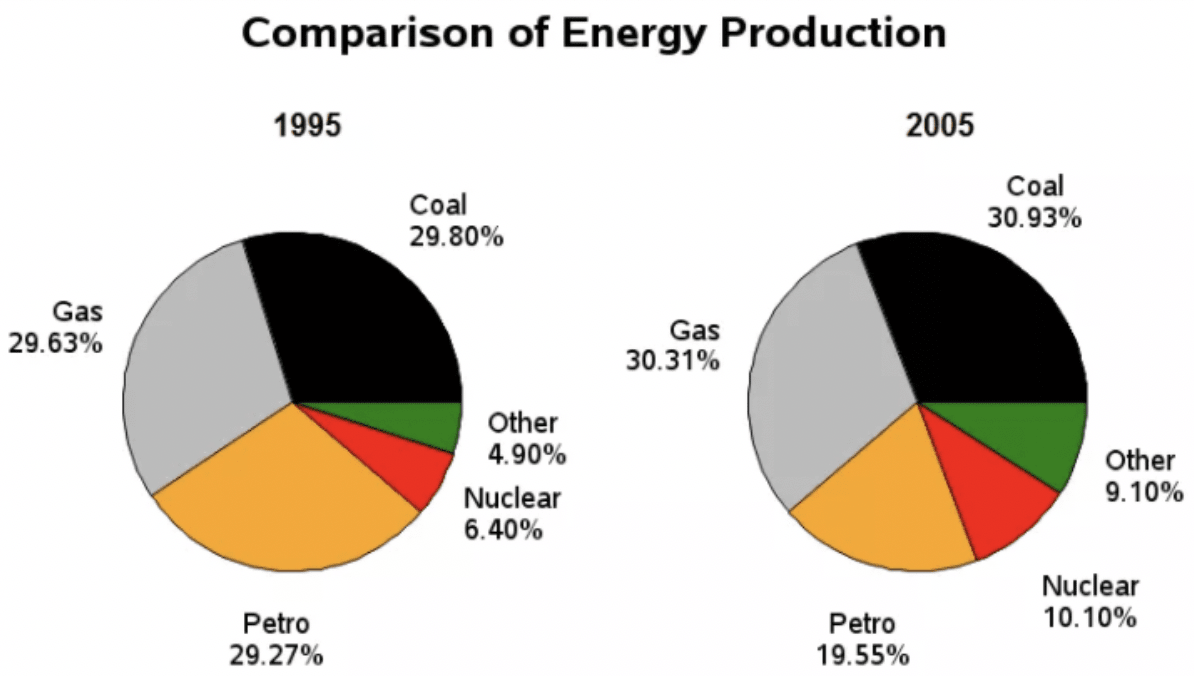
Energy production in France

Energy production in France
CN, 07/10/2018

The pie charts below show the comparison of different kinds of energy production in France in two years. Summarise the information by selecting and reporting the main features, and make comparisons where relevant.
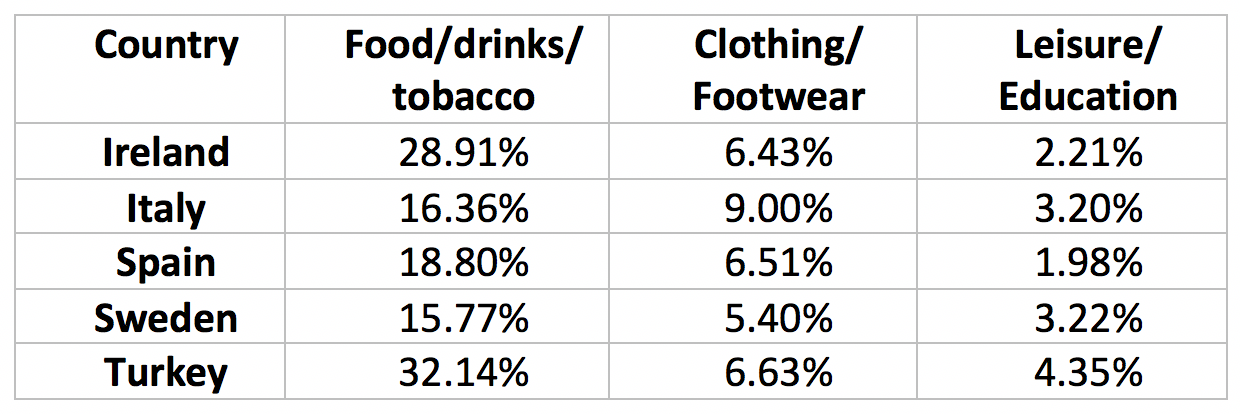
Sales of coffee and bananas

Sales of coffee and bananas
CN, 07/10/2018

The tables below give information about sales of Fairtrade*-labelled coffee and bananas in 1999 and 2004 in five European countries. Summarise the information by selecting and reporting the main features, and make comparisons where relevant.
Consumer spending

Consumer spending
T7, 06/10/2018

The table below gives information on consumer spending on different items in five different countries in 2002. Summarise the information by selecting and reporting the main features, and make comparisons where relevant.
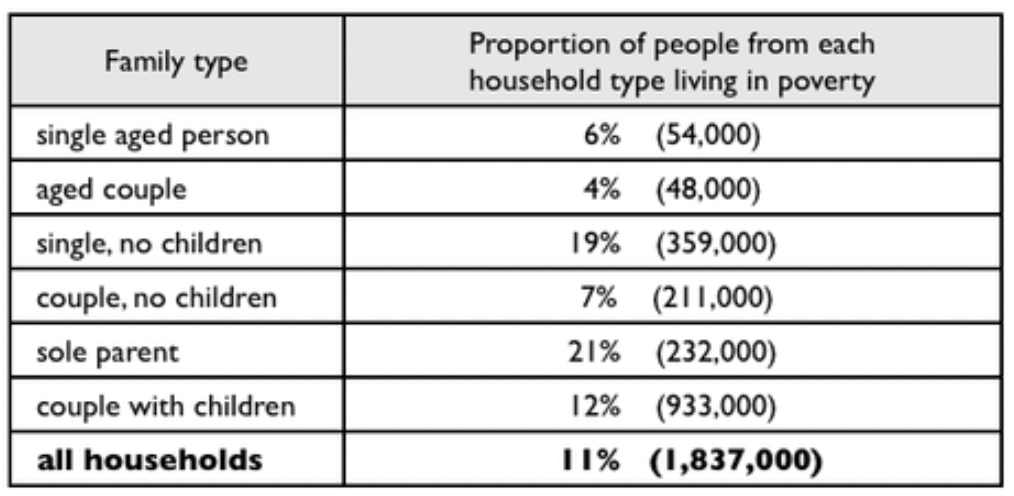
Proportion of family types

Proportion of family types
T7, 06/10/2018

The table below shows the proportion of different categories of families living in poverty in Australia in 1999. Summarise the information by selecting and reporting the main features, and make comparisons where relevant.
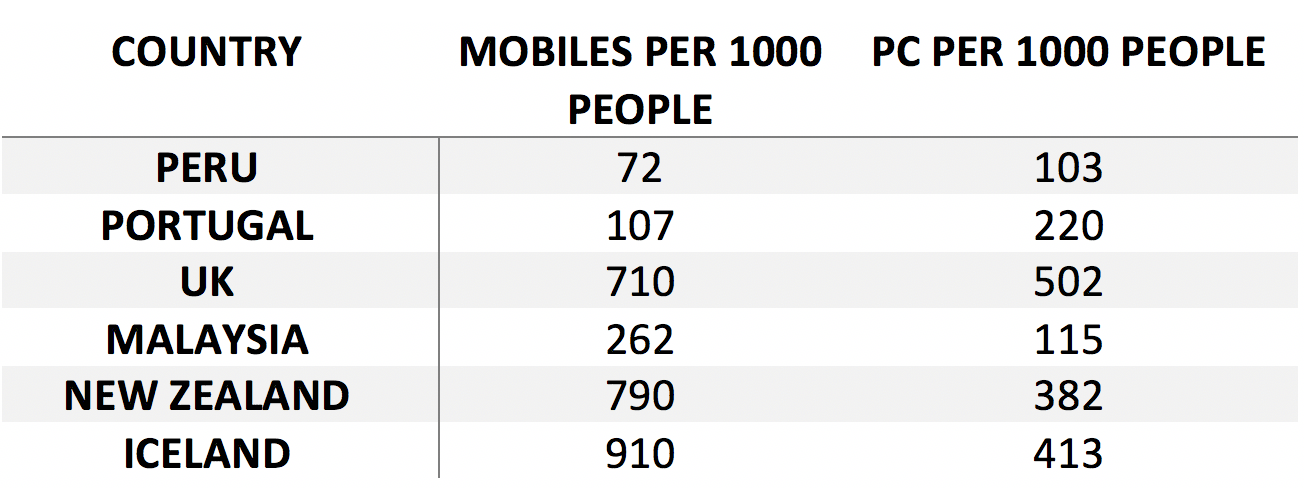
Ownership of PCs and Mobile phones

Ownership of PCs and Mobile phones
T7, 06/10/2018

The table below shows the number of personal computers and mobile phones per thousand people in six different countries in 2010. Summarise the information by selecting and reporting the main features, and make comparisons where relevant.
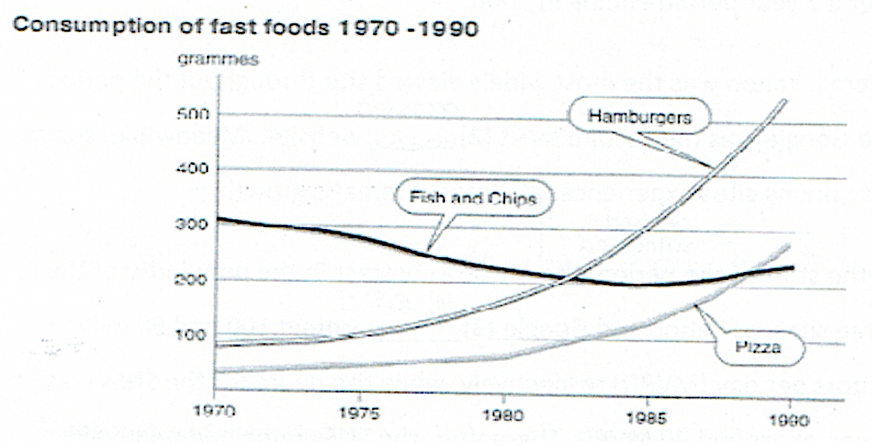
Consumption of fast foods 1970-1990

Consumption of fast foods 1970-1990
T6, 05/10/2018

The chart below shows the amount of three different fast foods consumed per person per week in a European country. Summarise the information by selecting and reporting the main features, and make comparisons where relevant.
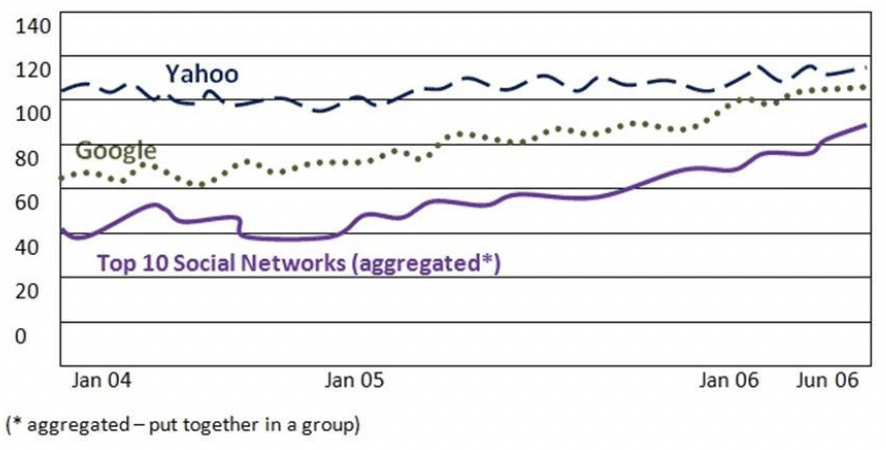
The popularity of social networking sites

The popularity of social networking sites
T6, 05/10/2018

The graph below shows the popularity of social networking sites compared to two internet search engines in the USA from January to June 2006. Summarise the information by selecting and reporting the main features, and make comparisons where relevant.
Sales of Books

Sales of Books
T6, 05/10/2018

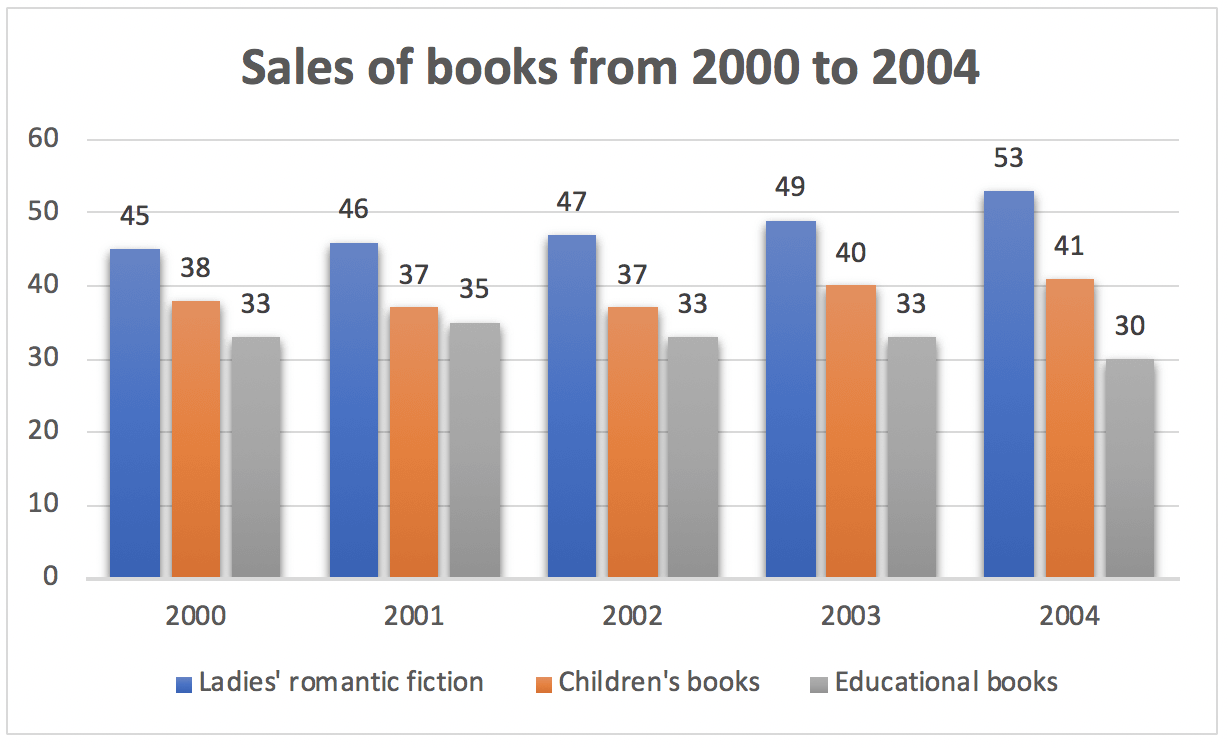
The chart below shows annual sales by value of different types of books at one chain of booksellers from 2000 to 2004. Summarise the information by selecting and reporting the main features, and make comparisons where relevant.
Tổng quan Writing task 1

Tổng quan Writing task 1
T6, 05/10/2018

Trong đề thi IELTS Academic Writing Task 1, bạn sẽ phải viết nhận xét về: Biểu đồ, bảng số liệu (a chart, table or graph) Line graph - Biểu đồ đường Bar chart - Biểu đồ cột đứng Stacked bar chart - Biểu đồ cột chồng Pie chart - Biểu đồ tròn Table - Bảng

Liên Kết Chia Sẻ

** Đây là liên kết chia sẻ bởi cộng đồng người dùng, chúng tôi không chịu trách nhiệm gì về nội dung của các thông tin này. Nếu có liên kết nào không phù hợp xin hãy báo cho admin.