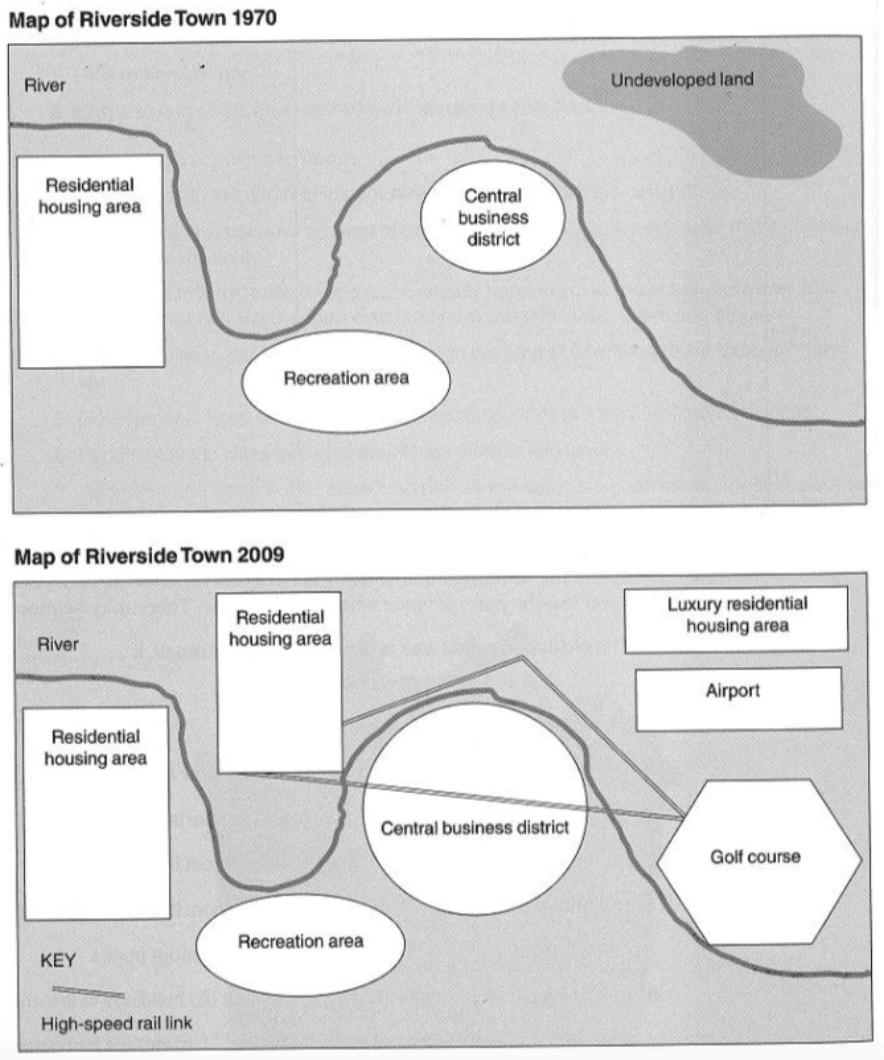
Riverside Town

Riverside Town
T4, 10/10/2018

The maps below show the changes experienced by Riverside town from 1970 to 2009. Summarise the information by selecting and reporting the main features, and make comparisons where relevant.
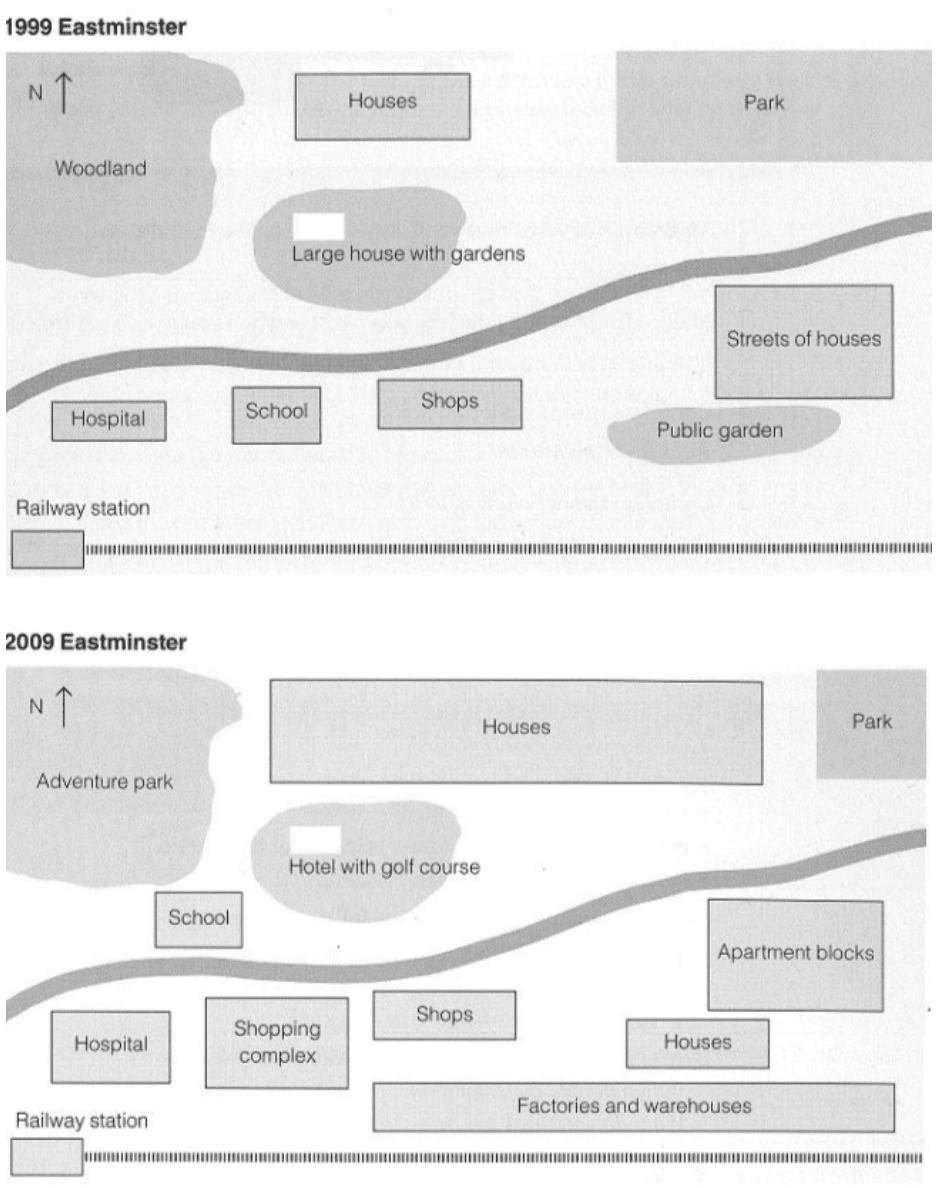
Eastminster village

Eastminster village
T4, 10/10/2018

The maps below show the transformation of the village of Eastminster over a ten-year period.  Summarise the information by selecting and reporting the main features, and make comparisons where relevant.
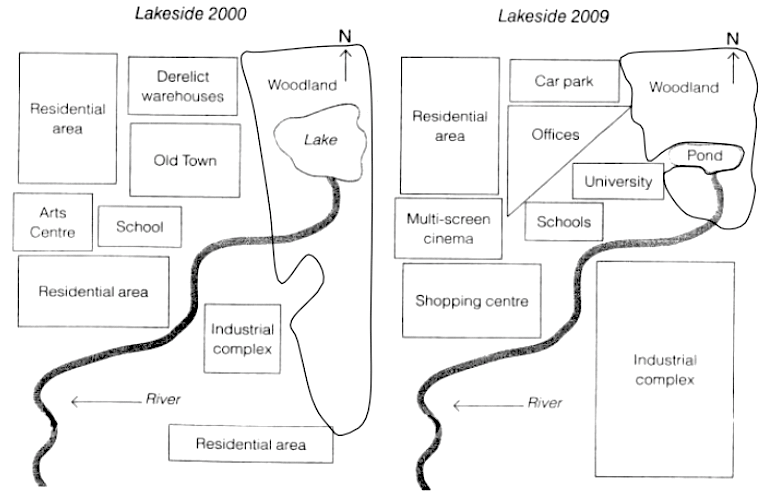
Lakeside town

Lakeside town
T4, 10/10/2018

The maps below show the changes experienced by the town of Lakeside at the beginning of the 21st Century. Summarise the information by selecting and reporting the main features, and make comparisons where relevant.
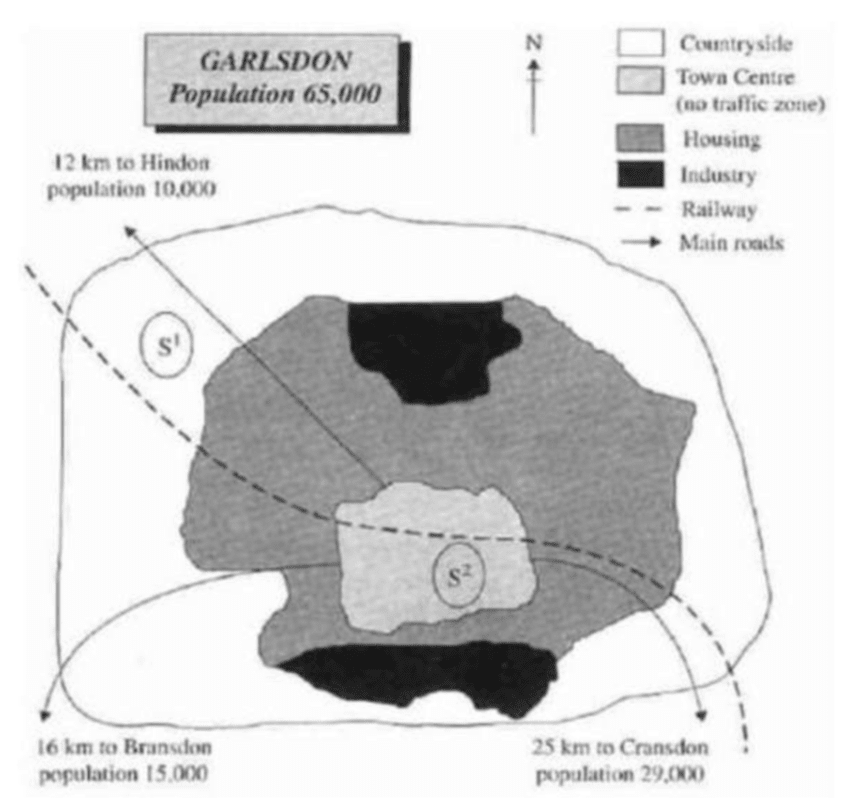
Garlsdon town

Garlsdon town
T4, 10/10/2018

The map below is of the town of Garlsdon. A new supermarket (S) is planned for the town. The map shows two possible sites for the supermarket. Summarise the information by selecting and reporting the main features, and make comparisons where relevant.
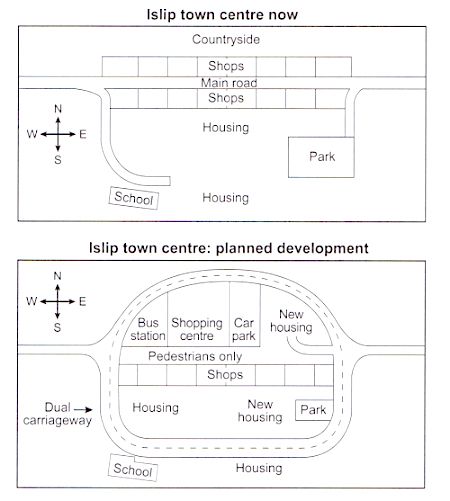
Islip town centre

Islip town centre
T4, 10/10/2018

The maps below show the centre of a small town called Islip as it is now, and plans for its development. Summarise the information by selecting and reporting the main features, and make comparisons where relevant. (Nguồn: IELTS Cambridge 12 - Test 2)

Chorleywood

Chorleywood
T4, 10/10/2018

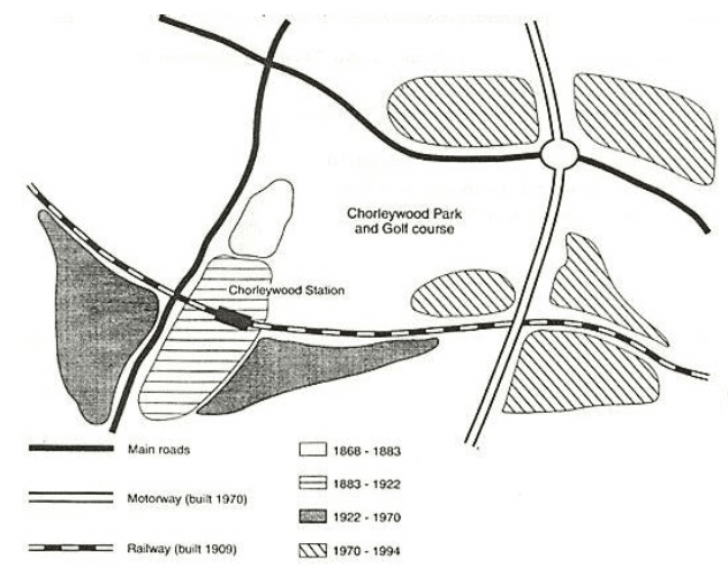
Chorleywood is a village near London whose population has increased steadily since the middle of the nineteenth century. The map below shows the development of the village. Write a report for a university lecturer describing the development of the villag

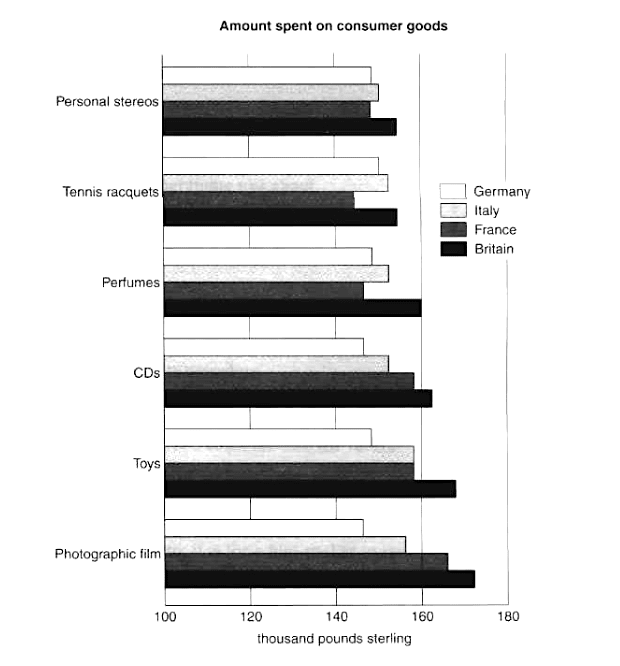
Spending on consumer goods

Spending on consumer goods
T3, 09/10/2018

The bar chart below gives information about the spending on consumer goods of four different countries. Summarise the information by selecting and reporting the main features, and make comparisons where relevant.
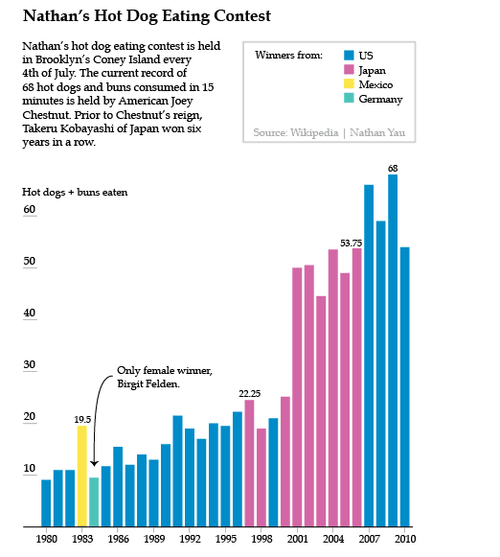
Hot dog eating contest

Hot dog eating contest
T3, 09/10/2018

The chart below shows how frequently people in the USA ate in fast food restaurants between 2003 and 2013. Summarise the information by selecting and reporting the main features and make comparisons where relevant.

Digital games sales

Digital games sales
T3, 09/10/2018

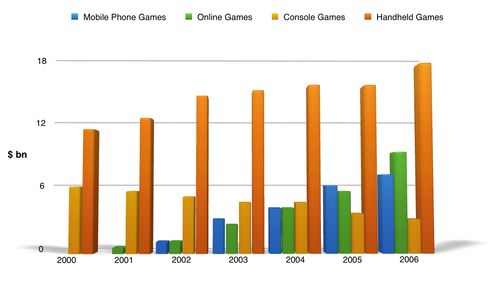
The bar graph shows the global sales (in billions of dollars) of different types of digital games between 2000 and 2006. Summarise the information by selecting and reporting the main features and make comparisons where relevant.

Lesson 2: Không thể xem thường Overview

Lesson 2: Không thể xem thường Overview
T2, 08/10/2018

Overview quan trọng như thế nào? Overview là phần cực kỳ quan trọng khi viết Writing task 1. Theo thầy Simon - giáo viên chấm thi IELTS giàu kinh nghiệm - bạn sẽ không thể được điểm cao nếu như phần Overview viết cẩu thả, sơ sài và thiếu ý. Lý do cho điề

Medal won in Olympic games

Medal won in Olympic games
T2, 08/10/2018

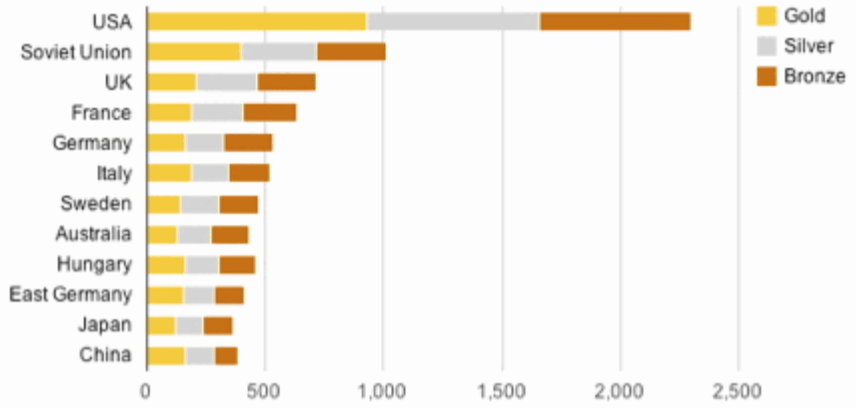
The chart below shows the total number of Olympic medals won by twelve different countries. Summarise the information by selecting and reporting the main features, and make comparisons where relevant.
Land degradation (Table + Pie chart)

Land degradation (Table + Pie chart)
T2, 08/10/2018

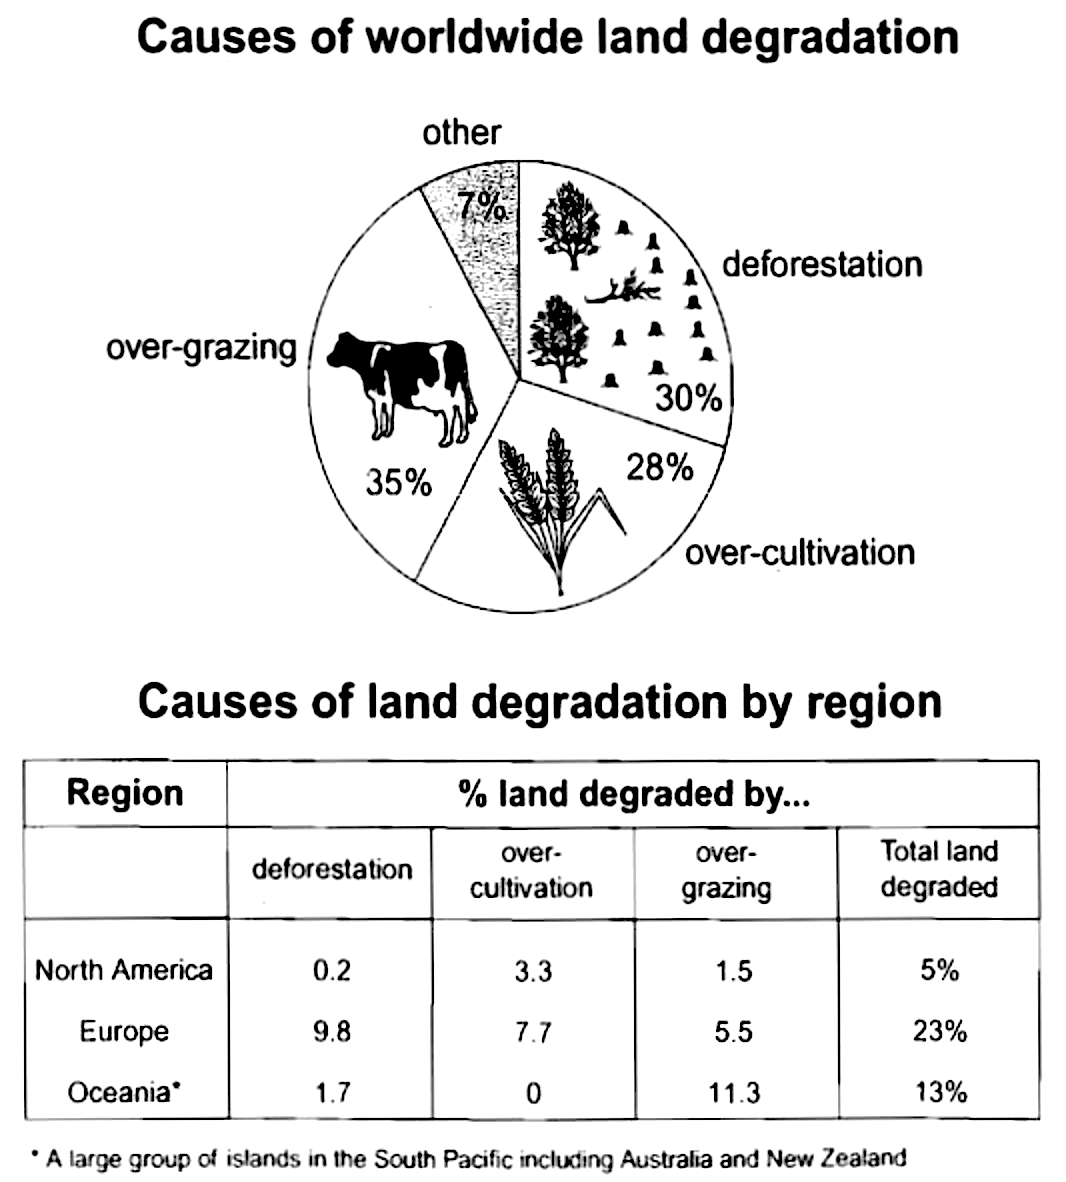
The pie chart below shows the main reasons why agricultural land becomes less productive. The table shows how these causes affected three regions of the world during the 1990s. Summarise the information by selecting and reporting the main features, and m

Liên Kết Chia Sẻ

** Đây là liên kết chia sẻ bởi cộng đồng người dùng, chúng tôi không chịu trách nhiệm gì về nội dung của các thông tin này. Nếu có liên kết nào không phù hợp xin hãy báo cho admin.