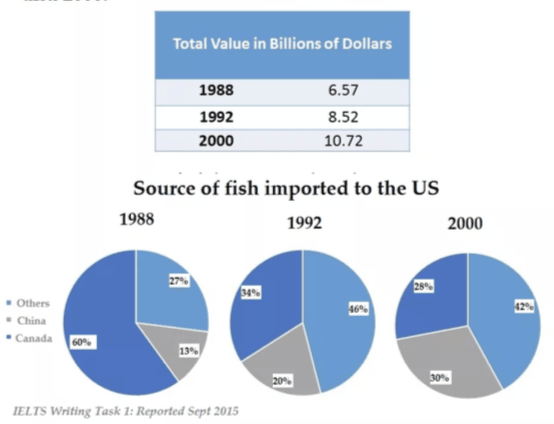
The pie charts and table give information about the total value and sources of fish imported to the US between 1988 and 2000.
Summarise the information by selecting and reporting the main features, and make comparisons where relevant.
Write at least 150 words
Sample answer
The table shows the value of fish that was imported to the US (measured in billions of dollars) in 1988, 1992 and 2000, while the three pie charts illustrate the amount of fish the US brought in from China, Canada and other countries in the same three years. Overall, the value of imports rose by almost double over the period given.
At the start of the period, the US imported fish predominantly from Canada, but other countries had become the main source by the final year. Regarding the table, the value of imports started at $6.57 billion in the first year, increasing to $8.52 in 1992 and reaching $10.72 in the last year.
In terms of the source of fish importation, Canada supplied the overwhelming majority in 1988 (60%) compared to China and other countries which provided only 13% and 27% respectively. By 1992, other countries had replaced Camada as the main supplier and made up 46% of all imports in 1992 and 42% by 2000. The figure of fish imports from Canada fell over the period by just over a half to 28% as opposed to China that witnessed an increase to 30% in 2000.
Count: 196 words
Ms Liz IELTS - Nguồn