The pie chart below shows the main reasons why agricultural land becomes less productive. The table shows how these causes affected three regions of the world during the 1990s.
Summarise the information by selecting and reporting the main features, and make comparisons where relevant.
Write at least 150 words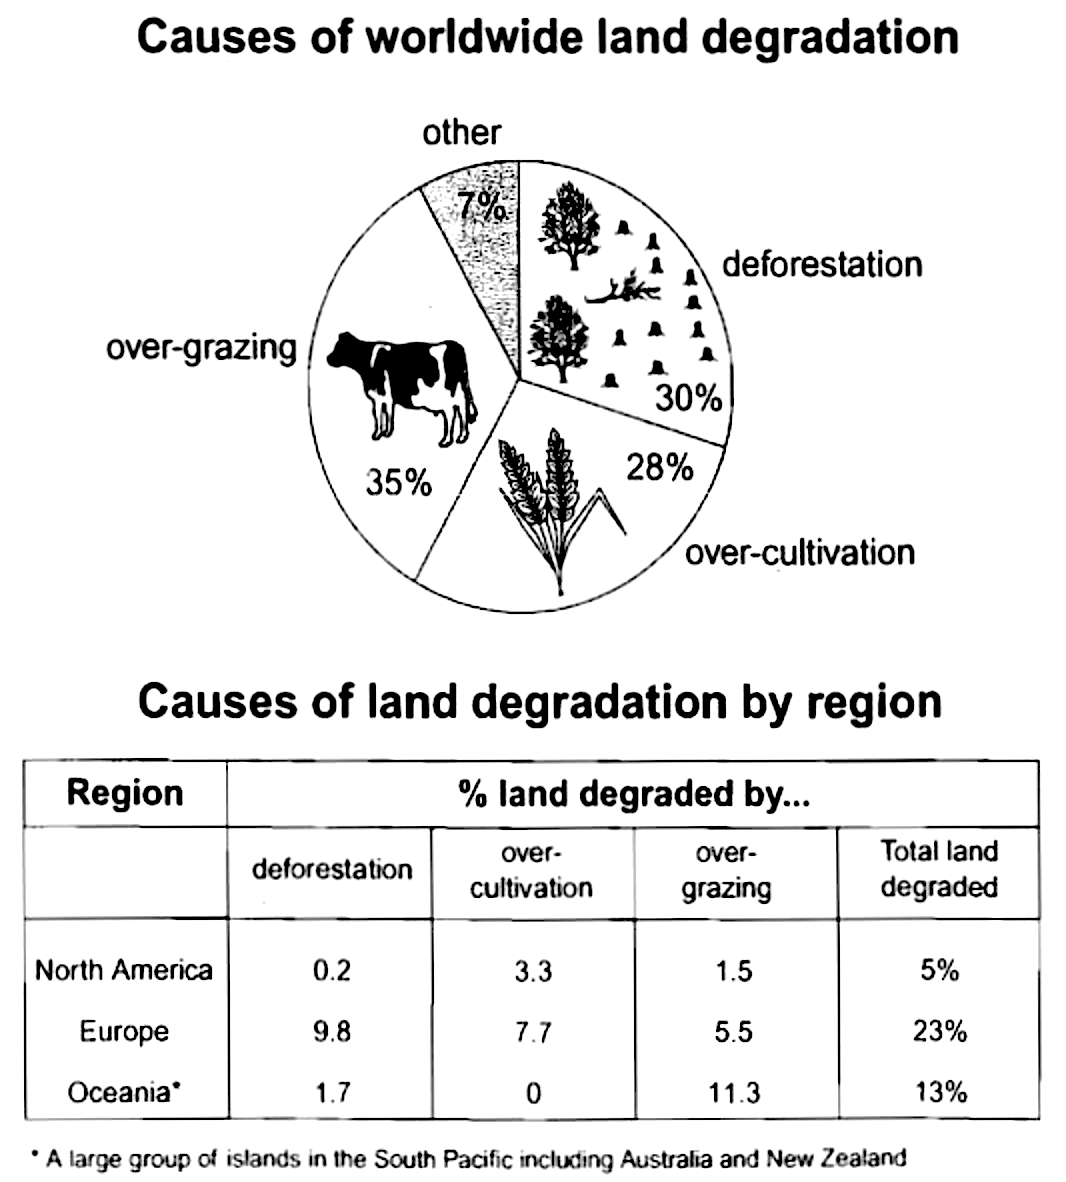
Nguồn: Cuốn Cambridge 8
Sample answer
The pie chart shows the proportions of primary causes leading to the degradation of farmland in the world, while the table gives information about the consequent land damage having on three distinct areas in the world in the 1990s.
Overall, it is also noticeable from the pie chart that the percentages of three principle reasons causing the land to be degraded were relatively similar although over-grazing appeared to be a little higher than the others. The table shows that Europe had a far higher proportion of unproductive land than Oceania or North America in the 1990s.
As shown in the pie chart, over-grazing accounted for the largest proportion of the total land degraded in the world, at 35%, while the figures for deforestation and over-cultivation were also high with 30% and 28% respectively.
It can be seen from the table that Europe had the highest total amount of unproductive land, at 23%, as opposed to those of Oceania and North America which were much lower, at 13% and 5% respectively. Deforestation and over-cultivation in Europe accounted for the largest proportions among the three regions given, at 9.8% and 7.7% respectively, while Oceania had the most unproductive land caused by over-grazing with 11.3%.
Word count: 202 words
Giáo viên Be Ready IELTS - Ms Thi