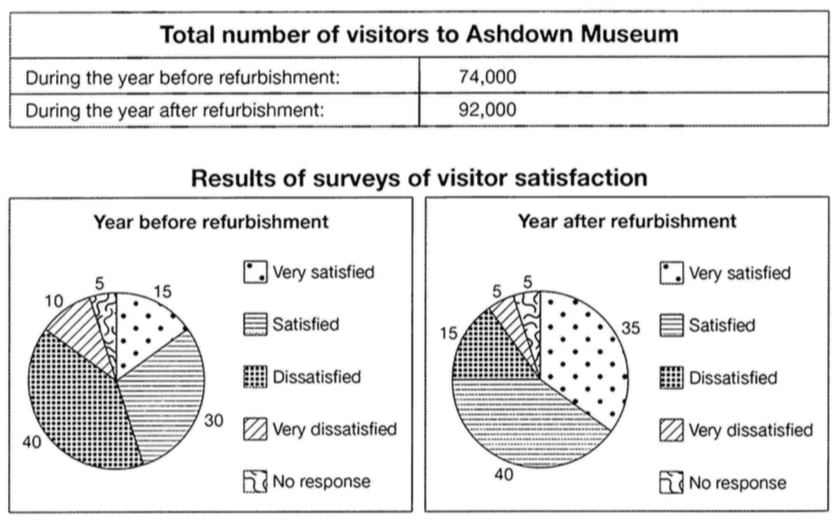
The table below shows the numbers of visitors to Ashdown Museum during the year before and after it was refurbished. The charts show the result of surveys asking visitors how satisfied they were with their visit, during the same two periods.
Summarise the information by selecting and reporting the main features, and make comparisons where relevant.
Write at least 150 words.
Nguồn: Cuốn IELTS Cambridge 11 - Test 4
Sample answer
The table given indicates the visitor numbers to the Ashdown Museum in a year before and after its renovation. Meanwhile, the pie charts give information about the proportions of satisfaction levels of visitors during the same two periods.
Overall, it is clear that the total quantity of visitors increased after refurbishment, together with the rise of pleasure level of people who visited this museum.
It can be seen clearly from the table that only after a year of renovation, the visitor number of the museum went up dramatically by almost 20,000 people, reaching 92,000 people. Similarly, the surveys of visitor satisfaction showed positive results with the proportions of visitors satisfied and very satisfied accounted for 75% altogether, increasing by 30% compared to those of the year before refurbishment. In contrast, there was a remarkable decline in terms of the percentages of people dissatisfied and very dissatisfied by 30%. Only a very small minority of people (5%) gave no response about how many found the newly-renovated museum for both of the two years before and after refurbishment.
Word count: 176 words
Giáo viên Be Ready IELTS – Ms Thi