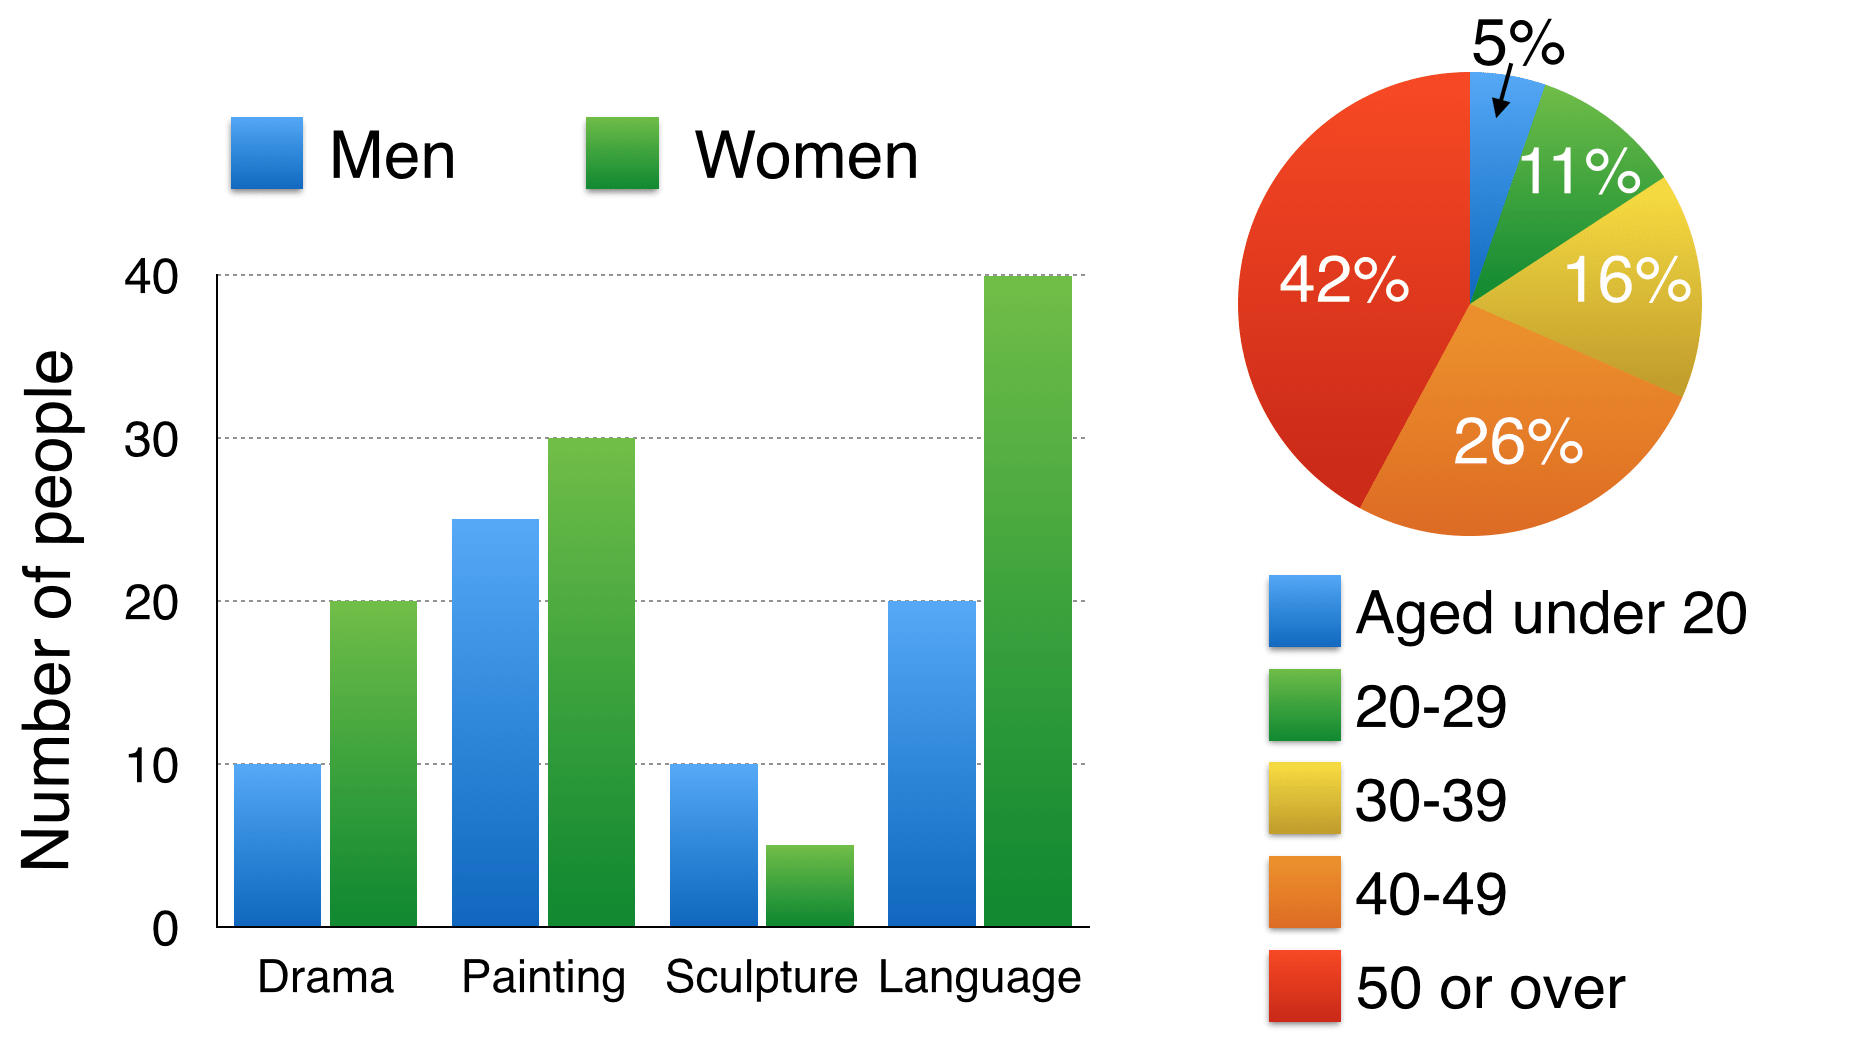
The bar chart below shows the numbers of men and women attending various evening courses at an adult education centre in the year 2009. The pie chart gives information about the ages of these course participants.
Summarise the information by selecting and reporting the main features, and make comparisons where relevant.
Write at least 150 words
Đề bài lấy từ trang web thầy Simon. Nguồn
Sample answer
The bar chart gives information about the numbers of males and females joining four evening courses at a vocational training centre in 2009, while the pie chart demonstrates the proportions of five age groups of these course learners.
Overall, there were more women than men attending vocational training courses, especially language, except for sculpture. The vocational training attracted senior learners mostly, while there was a minor percentage of teenage participants.
Regarding the language course which showed the most noticeable difference, there were twice as many female participants as male learners with 40 people and 20 people respectively. The learner number gap between two genders in drama and painting courses were 10 people and 5 people respectively. In contrast, more men joined the sculpture course than women, standing at 10 people and 5 people respectively.
Turning to the pie chart, the group of over-50-year-old people made up the largest proportion of the total number of course learners, reaching 42%, as opposed to the small minority of adolescent course participants (5%). The age group of 40 to 49 years old constituted the second highest percentage with 26%. The two groups of people aged 20-29 and 30-39 accounted for a relatively similar figure, standing at 11% and 16% respectively.
Word count: 204 words
Giáo viên Be Ready IELTS - Ms Thi